Sequence PowerPoint Charts
Harness the power of time-series data with sequence chart templates in PowerPoint. Combining charts with sequential elements, they track metrics, growth, and cycles for insightful presentations.
Data enthusiasts and strategists favor their accuracy, with adjustable scales and trend lines. PowerPoint`s charting engine powers dynamic updates, keeping your visuals current.
Great for sales forecasts or performance reviews, options span stacked areas to waterfall sequences. Make data dance across your slides.
Chart ahead - view our PowerPoint sequence charts collection.
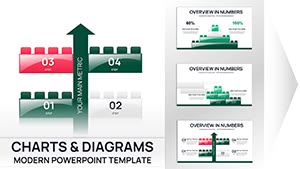
42-Slide Building Blocks PowerPoint Chart Template - Instant Download for Investor Presentations
ID: #PC01107
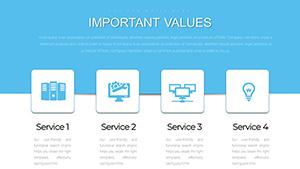
Empower Your Architectural Vision with Strategic PowerPoint Charts
ID: #PC00740
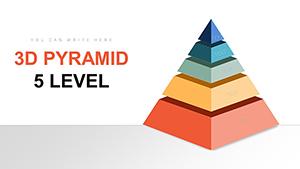
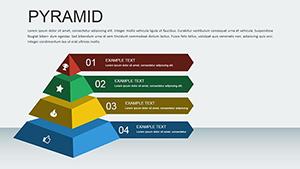
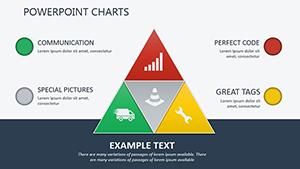
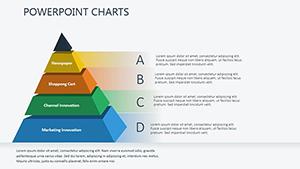
5-Level 3D Pyramid PowerPoint Charts Template: Unlock Hierarchical Insights
ID: #PC00727
Economic Charts in PowerPoint - Fully Editable | ImagineLayout
ID: #PC00669
Professional Data Analysis PowerPoint Charts Template - Fully Editable & Instant Download
ID: #PC00662
Important Questions PowerPoint Charts - Cycle Presentation Template
ID: #PC00623
Maslow Needs Pyramid PowerPoint Charts Template
ID: #PC00598
Training Courses PowerPoint Charts Template: Inspire Learning with Visuals
ID: #PC00594
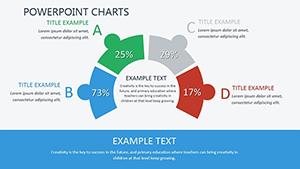
Analysis and Planning PowerPoint Charts: Download PPTX
ID: #PC00593
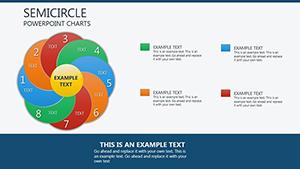
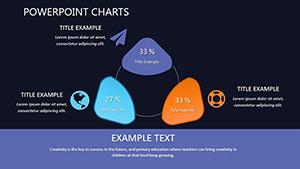
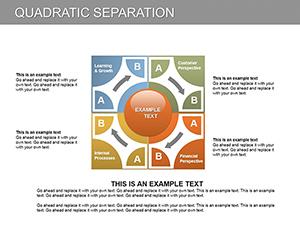
Analysis Circle PowerPoint Charts Template: Decode Data Dynamics
ID: #PC00090
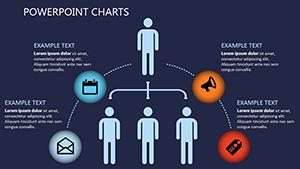
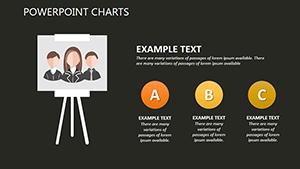
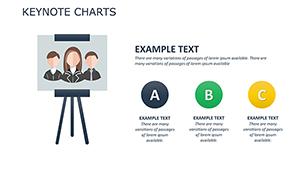
Employee Vision Plans PowerPoint Charts Template - Download Presentation
ID: #PC00535
Pyramid Animation PowerPoint Charts
ID: #PC00432
Christmas PPT Charts - Instant Download
ID: #PC00430
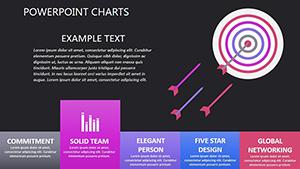
Targets Needed PowerPoint Charts for Goal Setting
ID: #PC00413
Website Promotion PowerPoint Charts Template: Drive Traffic and Conversions
ID: #PC00411
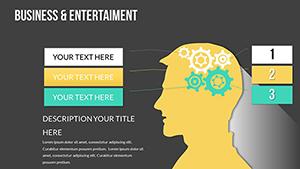
User Experience PowerPoint Charts for Professional Presentations
ID: #PC00404
Event Management PowerPoint Charts Template: Efficient Planning Tools
ID: #PC00397
SWOT Analysis PowerPoint Charts: Pro Templates
ID: #PC00390
HR Employee Analytics PowerPoint Charts
ID: #PC00381
HR Employee Benefits Process Charts Template
ID: #PC00380
Pyramid of Needs PowerPoint Charts: Download PPTX
ID: #PC00343
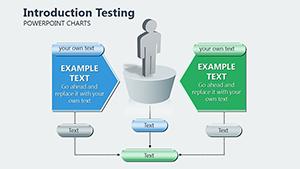
Introduction Testing PowerPoint Charts Template
ID: #PC00270
Mutually Benefit PowerPoint Charts Template
ID: #PC00184
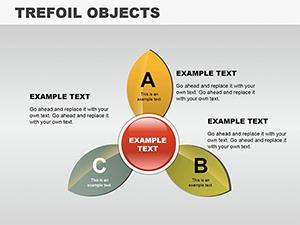
Trefoil Objects PowerPoint Charts Template: Unique Data Shapes for Impact
ID: #PC00112
Edge of Sequence Charts Sequence charts fuse progression with quantification, eclipsing isolated graphs with contextual timelines. Basic PowerPoint charts lack connectors; templates bridge them with phased indicators.
Economists plot GDP sequences; HR tracks turnover trends. Planners forecast resource allocations. Standout: Gradient fills for momentum.
Trend Highlighting: Built-in sparklines.Phase Markers: Event dots on lines.Data Linking: Live Excel ties. Strategic Deployments CEOs review quarterly KPIs; scientists sequence experiment results. Tip: Use error bars for variability.
PowerPoint wipes animate data accrual.
Fine-Tuning Charts Recolor series thematically; add data labels selectively. Rotate for portrait needs.
Illustration: Stock price sequence with volume overlays or budget burn rates. Amplifies analytical depth by 70%.
Input series data. Configure axis sequences. Grow effects for builds. Unconventional Charting Artists sequence color evolutions; chefs track recipe iterations. Flexibility fuels discovery.
Analytics Optimization Normalize scales for fairness; include sources. Animate outliers for emphasis.
Sequence your analytics - download and delineate data flows.
Frequently Asked Questions Trends to triumphs - claim your charts today.