Scrum process Keynote Charts

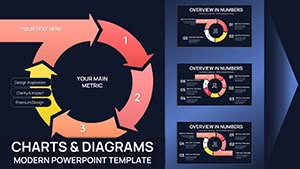
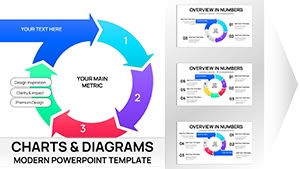
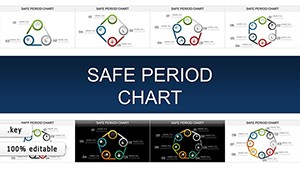
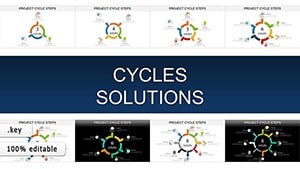
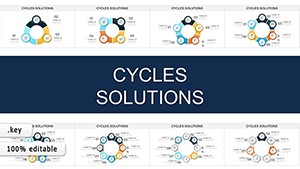
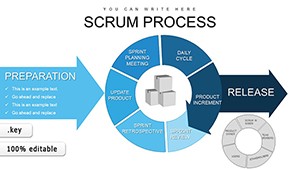
Transform your agile storytelling with our curated Scrum process charts tailored for Keynote. These vibrant visuals capture the essence of Scrum - from epic planning to retrospective insights - making every presentation a catalyst for team synergy. Ideal for Scrum Masters guiding remote squads or executives pitching agile transformations, these charts distill complexity into compelling narratives.

Featuring fluid animations and responsive designs, each template adapts effortlessly to your brand`s voice. Edit burndown graphs, task boards, and impediment logs with intuitive tools, ensuring your message lands with precision and flair.

Suited for creative professionals, IT leads, and innovation hubs, these charts promote transparency and momentum. Dive into our selection and craft slides that not only inform but energize your audience.

Empower your workflow - browse Keynote Scrum charts and secure instant downloads.
View by: Last Added | Most Popular
  • like 5
    (12)
    Dental Charts Keynote Template: Illuminate Oral Health Insights
    ID: #KC01034
    $22.00
  • like 3
    (1065)
    Safe Period Charts for Keynote: Illuminating the Rhythms of Change
    ID: #KC00903
    $20.00
  • like 5
    (196)
    Project Cycle Steps Keynote Charts: Charting Pathways to Project Triumph
    ID: #KC00902
    $20.00
  • like 2
    (370)
    Cycles Solutions Keynote Charts: Transform Data into Compelling Narratives
    ID: #KC00901
    $20.00
  • like 3
    (963)
    Scrum Agile Development Process: Keynote Charts for Efficient Teams
    ID: #KC00856
    $18.00
  • like 2
    (347)
    Dollars Worth Money Keynote Charts: Navigate Global Finance with Cycle Visuals
    ID: #KC00835
    $15.00
  • like 2
    (840)
    Agile Methodology Keynote Charts: 45 Slides
    ID: #KC00831
    $13.00
  • like 2
    (770)
    Agile Scrum Methodology Process Flow Keynote Charts Template
    ID: #KC00829
    $18.00
  • like 3
    (593)
    Scrum Agile Process Keynote Charts Template
    ID: #KC00828
    $18.00
  • like 3
    (735)
    Scrum Process Flow Pie Keynote Charts Template
    ID: #KC00795
    $20.00
  • like 4
    (882)
    Cycle 5 Arrows Keynote Charts: Streamline Your Process Visualizations
    ID: #KC00779
    $18.00
  • like 5
    (741)
    Cycle 6 Arrows Keynote Charts: Enhance Workflow Depictions with Precision
    ID: #KC00778
    $18.00
  • like 3
    (140)
    7-Step Cycle Arrows Keynote Charts Template: Streamline Your Process Visualizations
    ID: #KC00777
    $18.00
  • like 4
    (386)
    8-Step Cycle Arrows Keynote Template: Master Complex Process Flows
    ID: #KC00776
    $18.00
  • like 2
    (196)
    9-Step Cycle Arrows Keynote Charts: Unlock Detailed Process Mastery
    ID: #KC00775
    $18.00
  • like 5
    (597)
    10-Step Cycle Arrows Keynote Template: Comprehensive Process Visualization
    ID: #KC00774
    $19.00
  • like 3
    (129)
    11-Step Cycle Arrows Keynote Charts for Dynamic Presentations
    ID: #KC00773
    $20.00
  • like 3
    (16)
    12-Step Cycle Arrows Keynote Charts: Streamline Your Process Narratives
    ID: #KC00772
    $20.00
  • like 4
    (23)
    Collection Periods Cycle Keynote Charts: Simplifying Financial Flows
    ID: #KC00760
    $22.00
  • like 4
    (80)
    Business Analysis Keynote Charts Template: Presentation
    ID: #KC00716
    $22.00
  • like 5
    (699)
    Employee Training Methods Keynote Charts and Diagrams: Infographic Template
    ID: #KC00715
    $15.00
  • like 3
    (523)
    Price Strategy Keynote Charts Template: Craft Winning Pricing Models with Visual Precision
    ID: #KC00608
    $22.00
  • like 5
    (229)
    Revolutionize Your Research Presentations with Research Methods Keynote Charts Template
    ID: #KC00583
    $15.00


Key Applications of Scrum Charts in Keynote Environments

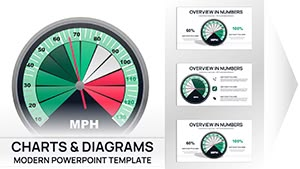
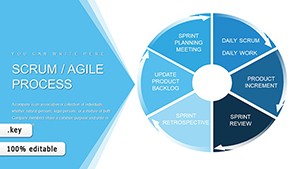
Keynote`s sleek interface pairs perfectly with Scrum charts for diverse scenarios. In startup pitches, showcase velocity trends to highlight scalable growth potential. For internal audits, retrospective charts facilitate honest discussions on bottlenecks, fostering continuous improvement.

Educators leverage these for curriculum mapping, aligning learning objectives with iterative cycles. Marketing teams adapt them for campaign roadmaps, tracking KPIs against sprint goals with eye-catching infographics.

Scrum Charts vs. Built-in Keynote Features

Keynote`s native shapes require extensive tweaking for Scrum specifics, often leading to inconsistent results. Our templates provide ready-to-use frameworks with embedded transitions, surpassing defaults in both functionality and polish.

  • Efficiency Boost: Pre-animated sequences save editing time.
  • Design Consistency: Unified color schemes and fonts for professional polish.
  • Data Integration: Support for live charts synced with Numbers spreadsheets.

Standout Features and Implementation Strategies

Our Keynote Scrum charts stand out with accessibility features like high-contrast modes and alt-text prompts, ensuring inclusivity. Follow best practices by anchoring charts to key talking points, using builds to reveal data progressively for maximum retention.

Teams using these report heightened morale from visually tracked achievements, underscoring their motivational edge. Integrate with collaboration tools like Slack for real-time updates during virtual stand-ups.

Innovative Ways to Deploy These Charts

Blend Scrum visuals with mind maps for brainstorming epics, or overlay heatmaps on role diagrams to spotlight training needs. In client demos, interactive hotspots link charts to case studies, deepening engagement.

Seasonal themes - think festive icons for year-end reviews - add personality without sacrificing clarity. Such creativity keeps presentations fresh and memorable.

Frequently Asked Questions

Harness the full potential of these charts to drive agile success. Grab your Keynote template and lead with confidence.

Pro Tips for Seamless Integration

Sync charts with iCloud for team edits, enabling real-time refinements. Use Keynote`s presenter notes to embed facilitation cues, enhancing delivery. For larger audiences, export to PDF with hyperlinks intact for post-meeting access.

Monitor feedback loops: Survey attendees on visual clarity to iterate designs iteratively - fittingly Scrum-like.

Sector-Tailored Examples

  1. Non-Profits: Track fundraising sprints with donor journey maps.
  2. Retail: Optimize inventory via backlog visualizations.
  3. Consulting: Demonstrate ROI through comparative velocity slides.

These examples illustrate broad applicability, empowering diverse users.

Embrace innovation with tools that evolve with you. Update your arsenal today and watch productivity soar.

Discover endless possibilities - download and design!