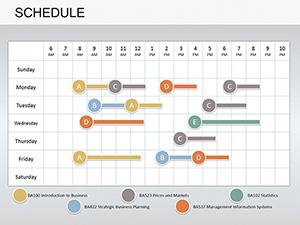
Master time management in your presentations with our specialized schedule diagrams for PowerPoint. Tailored for project managers, event planners, and team leads, these templates turn complex timelines into straightforward visuals that drive decisions.
Featuring Gantt charts, flow timelines, and milestone markers, each diagram is built for clarity and adaptability. Adjust durations, dependencies, and labels effortlessly to reflect your unique schedule, whether it`s a quarterly rollout or a wedding itinerary. Our designs use intuitive color coding - greens for on-track, reds for delays - to make status updates glanceable.
Perfect for agile teams tracking sprints or educators outlining semester plans, these diagrams enhance collaboration and reduce miscommunication. With drag-and-drop editing, you`ll spend less time formatting and more time strategizing. Dive into our library and bring order to your timelines today.


Unlike basic bullet lists, our PowerPoint schedule diagrams provide a bird`s-eye view of progress, helping teams spot bottlenecks early. Developed with input from certified PMPs, they incorporate best practices like critical path highlighting and resource allocation grids.
For example, the Multi-Project Gantt template allows overlaying several timelines, ideal for agencies juggling client deadlines. Sales directors use linear schedules to forecast quarterly targets, plotting leads against conversion dates with progress bars.
Versus default PowerPoint shapes, our templates include pre-set formulas for auto-calculating end dates, saving hours and minimizing errors in dynamic environments.
Construction firms visualize build phases from foundation to finishing, with weather contingency branches. In education, professors map course modules, linking to readings and assessments for student portals.
Marketing teams chart campaign launches, from ideation to ROI analysis, using swimlane diagrams to assign roles. Healthcare schedulers plot patient flows, ensuring compliance with regulatory timelines.
These tools foster accountability, as visual cues make responsibilities crystal clear during reviews.
Begin with a clean canvas: Import your data via CSV for bulk updates, then refine aesthetics with theme-matching fonts. Limit colors to three for accessibility, and include legends for color-blind viewers.
For live sessions, embed zoom effects on dense timelines to focus on current milestones. Regularly update via cloud sync to keep remote teams aligned. Remember, brevity is key - aim for one diagram per major phase to avoid overload.
Advanced users can script VBA for auto-populating from calendars, turning static slides into living dashboards.
A startup pitched funding rounds using a spiral timeline, curving from seed to Series A with revenue projections - securing investment on the spot. Non-profits tracked grant milestones, visually appealing to donors with photo placeholders along the path.
In retail, inventory restock cycles were diagrammed with alert icons for low-stock triggers, streamlining operations. These stories highlight how our templates spark innovation beyond mere scheduling.
Yes, seamless linking ensures real-time synchronization.
Built-in animations simulate completion for engaging demos.
Kanban and Scrum boards are included for iterative planning.
Fully adjustable from hours to years.
Responsive designs ensure clarity on all devices.
Cloud-compatible for shared editing sessions.
Streamline your schedules effortlessly - select and download the perfect diagram to keep projects on track.
Copyright © 2009-2026 ImagineLayout All rights reserved.