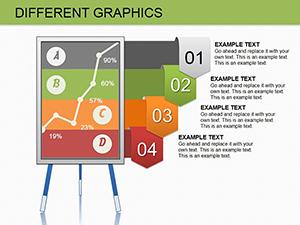
Transform your sales strategies with our exclusive sale on PowerPoint diagram templates, where dynamic visuals meet unbeatable value. These diagrams - flowcharts, org charts, pie graphs, and more - are engineered to clarify complex data, making your pitches irresistible to clients and teams alike.
Ideal for sales managers, marketers, and business developers, this collection helps distill quarterly forecasts, funnel analyses, or competitive landscapes into digestible slides. Each template is fully vector-based, ensuring scalability without quality loss, and compatible with PowerPoint 2016 and later versions.
During this limited-time offer, enjoy up to 50% off premium designs that save hours of creation time. Whether closing deals or training reps, these tools amplify your message with precision and polish. Don`t miss out - stock up on diagrams that drive results and fit your budget.
Our discounted PowerPoint diagram templates stand out by combining affordability with high-impact functionality. Standard diagrams often feel cluttered; ours prioritize clean lines, intuitive layouts, and color-coded elements for instant comprehension. Save not just money but time - import data via Excel links for real-time updates.
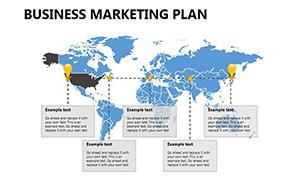
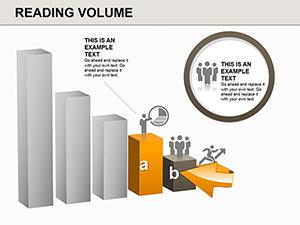
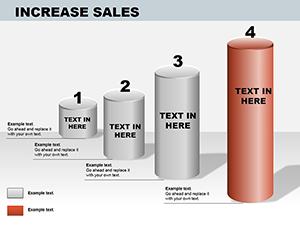
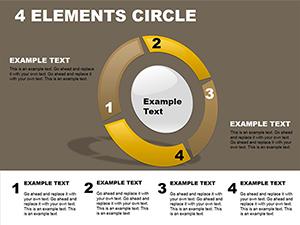
Sales pros love how these templates visualize pipelines, turning abstract metrics into compelling narratives. For instance, a radial diagram can map customer journeys, highlighting drop-off points for targeted improvements.
Versus default PowerPoint shapes, these offer pre-animated transitions and themed variants, enhancing engagement without extra effort.
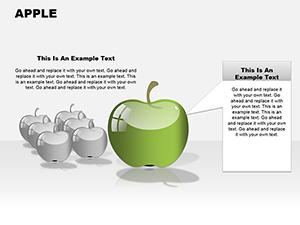
Layer diagrams progressively: Start simple, build complexity. Use consistent branding - match your company`s palette for cohesion. Animate elements sparingly to guide the eye, avoiding overload. Export as videos for email follow-ups to extend reach.
Example: A tech sales team slashed presentation prep by 40% using our discounted SWOT analysis diagrams, leading to a 25% close rate increase. Another rep adapted a Venn diagram for overlap analysis, winning a multi-year contract.
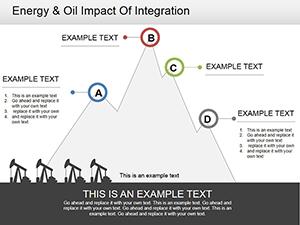
Beyond basics, explore advanced options like Sankey diagrams for resource flows or bubble charts for market sizing. These sale items cater to startups scaling budgets or enterprises optimizing spends. Integrate with tools like Tableau for hybrid visuals.
With over 100 templates on offer, from minimalist wireframes to bold infographics, there`s something for every pitch style. Pair with our free icons library for added flair. Act fast - these deals fuel your success without breaking the bank.
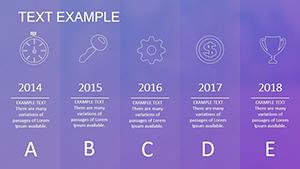
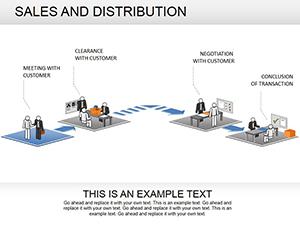
The collection features flowcharts, pyramids, timelines, and process maps, all optimized for sales storytelling.
Yes, most work with PowerPoint 2010+, with fallback options for earlier editions.
Discounts auto-apply at checkout for eligible items; no codes needed during the promotion.
Certainly - adapt for project management, education, or any data-driven talk.
Templates are fully editable; for advanced tweaks, our support team offers guidance.
Yes, 30-day satisfaction guarantee applies to all purchases.
Seize this opportunity to arm your sales arsenal with top-tier diagrams at a fraction of the cost. Your next big win starts with a slide - download and deploy today!
Copyright © 2009-2026 ImagineLayout All rights reserved.