Master the art of visualization with our process chart PowerPoint templates, designed to map out workflows, stages, and sequences with precision and elegance. These tools turn tangled procedures into straightforward diagrams, making it easy to illustrate everything from manufacturing lines to software development cycles.
Aimed at project managers, consultants, and operational teams, they offer benefits like enhanced clarity, reduced errors in explanations, and faster team alignment. No more confusing text walls - opt for charts that speak volumes.
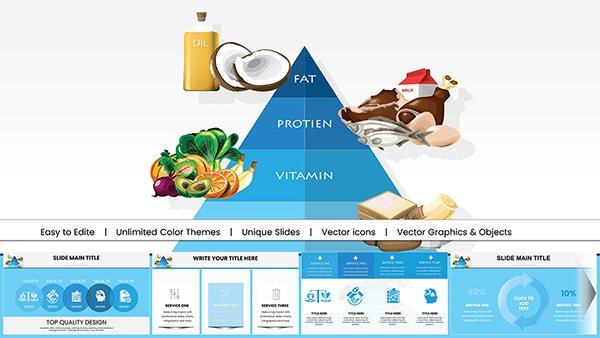
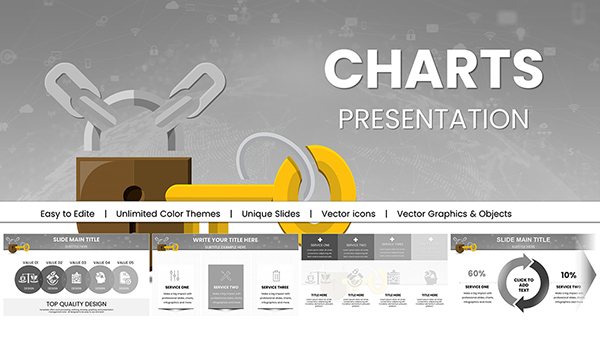
With drag-and-drop editing and scalable vectors, adaptation is a breeze. Browse this category to discover templates that fit your specific process needs and propel your presentations forward.

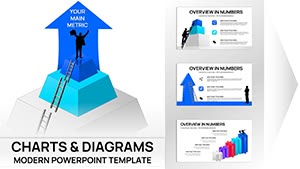

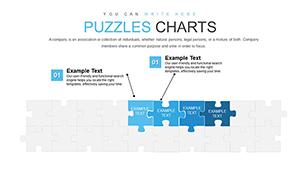
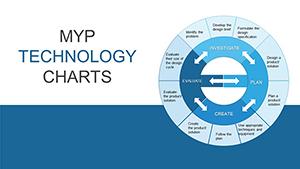
Default PowerPoint charts often lack the detail for intricate processes, leading to cluttered slides. Our templates counter this with modular designs - think arrow-linked boxes for steps or circular flows for cycles - that adapt to any complexity, ensuring your audience follows effortlessly.
For a supply chain overview, a linear flowchart reveals bottlenecks at a glance, unlike vague bullet lists.
This approach not only saves design time but also amplifies comprehension, turning passive viewers into active participants.
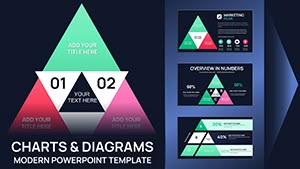
Layer your charts progressively: introduce the overview first, then zoom into sub-processes. Use color coding for categories - greens for approvals, reds for risks - to guide the eye intuitively. Always include legends for standalone clarity.
For accessibility, add descriptive alt text to each element, supporting screen readers in professional settings.
Standout features include infinite scalability without pixelation and pre-animated transitions that reveal steps sequentially. Unlike basic tools, these templates integrate seamlessly with data imports from Excel, keeping your info current.
Transform your workflow - select a process template now and clarify your vision.
In healthcare, a hospital used our templates to chart patient intake flows, cutting wait times by 25% through visualized improvements. A tech firm mapped agile sprints with swimlane diagrams, fostering cross-team collaboration.
Such applications demonstrate how targeted visuals drive tangible results in dynamic environments.
Keep the momentum going - view all process charts and refine your strategies.
Copyright © 2009-2026 ImagineLayout All rights reserved.