Clarify workflows in Keynote with dedicated process charts, spanning flowcharts, cycle models, and bottleneck detectors. These visuals guide viewers through sequences, from ideation to execution.
Project managers, process engineers, and ops leads rely on them to dissect routines, identify redundancies, and propose refinements. Intuitive editing lets you mirror real systems accurately.
Turn abstract procedures into tangible roadmaps, fostering understanding and adoption. Efficiency starts with clear depiction.
Flow forward: View our processes Keynote charts and streamline your story.
Large Intestine Keynote Charts Template: Illuminate Anatomical Insights
ID: #KC00961
$18.00
(124)
Small Intestine Medical Keynote Charts Template
ID: #KC00960
$18.00
(140)
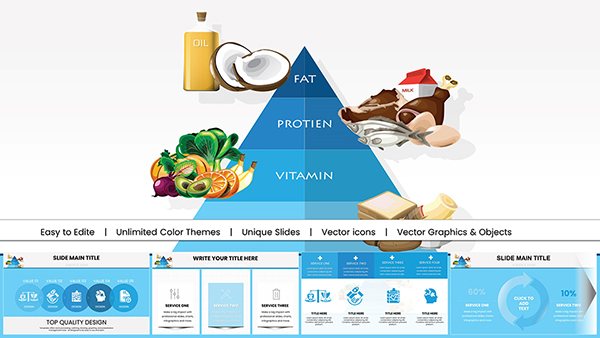
Vitamin K Keynote Charts Template: Unlock Nutritional Insights
ID: #KC00956
$20.00
(32)
Foods Vitamin E Keynote Charts Template: Antioxidant Power in Visuals
ID: #KC00955
$20.00
(5)
Nutritious Foods Vitamin D Keynote Charts: Sunshine Nutrient Visualized
ID: #KC00954
$20.00
(1198)
Vitamin C Supplements Keynote Charts Template: Energize Your Immune Narratives
ID: #KC00953
$20.00
(794)
Vitamin B Benefits Keynote Charts Template
ID: #KC00952
$20.00
(923)
Vitamin A and Mineral Supplements Keynote Charts
ID: #KC00951
$20.00
(874)
Vitamin A and Carotenoids Keynote Charts Template
ID: #KC00950
$20.00
(291)
Brain Five Senses Keynote Charts Template
ID: #KC00948
$18.00
(589)
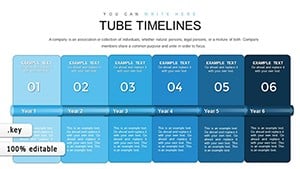
Tube Timeline Keynote Charts: Bring Sequences to Life
ID: #KC00855
$15.00
(678)
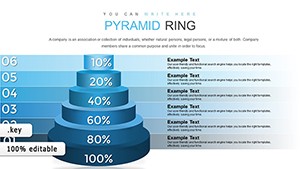
Pyramid Ring Keynote Charts: Master Farm Activity Analysis
ID: #KC00847
$18.00
(878)
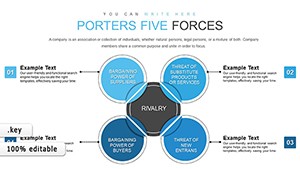
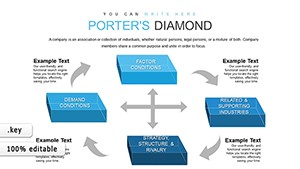
Porter's Five Forces Keynote Charts: Master Competitive Strategy
ID: #KC00825
$15.00
(140)
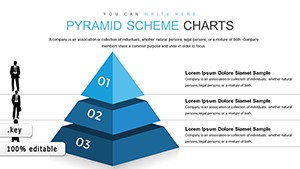
Pyramid Scheme Keynote Charts
ID: #KC00816
$18.00
(951)
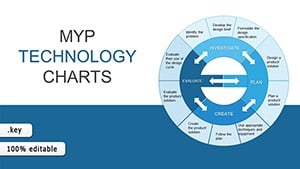
MYP Technology Keynote Charts Template
ID: #KC00813
$20.00
(748)
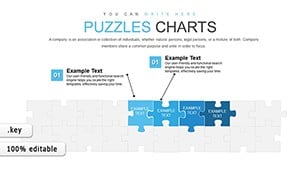
Puzzles for Analytics Interviews: Hexagon Keynote Charts Unleashed
ID: #KC00812
$20.00
(997)
Elevate Strategic Insights with 3D Cubes Porter's Five Forces Charts
ID: #KC00806
$15.00
Visualizing Workflows with Process Charts
Processes Keynote charts illuminate operational intricacies, using arrowed paths and decision nodes that eclipse linear lists. Manufacturing overseers employ them for assembly line audits, pinpointing delays via color-coded segments.
Beyond basics, they feature swimlane divisions for cross-team accountability. Benefit: Blueprints that blueprint improvements precisely.