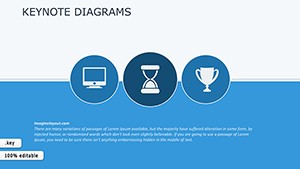
Bring data to life in Keynote with procedure templates dedicated to diagrams, walking you through construction from basic shapes to complex networks. Geared toward analysts, presenters, and strategists, these templates simplify visualizing hierarchies, flows, and relationships.
They deliver advantages like scalable vectors and interactive elements that make abstract concepts tangible, impressing audiences every time. Effortlessly build diagrams that inform and persuade.
Compatible with Keynote`s drawing tools, with export paths for reports. Explore our Keynote diagram procedure templates and chart your success.


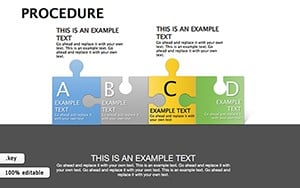
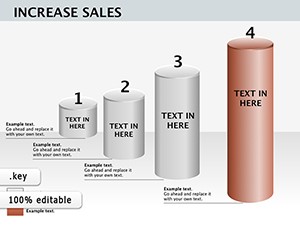
HR pros map org structures with expandable nodes, clarifying reporting lines during restructures. Marketers diagram customer journeys, pinpointing touchpoints with metric callouts for optimized funnels.
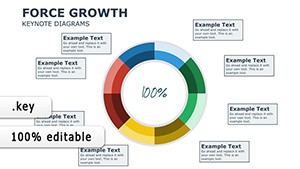
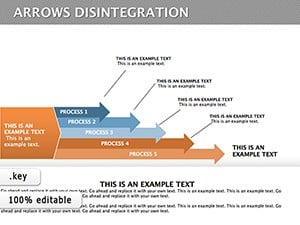
In engineering, teams flowchart prototyping steps, integrating tolerances for precise builds. Consultants visualize SWOT analyses in radial diagrams, uncovering insights at a glance. Researchers sequence experiment flows, with branch points for variables that aid peer reviews.
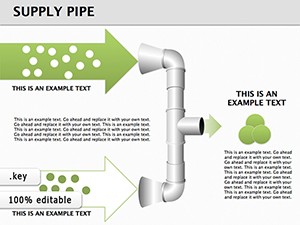
Keynote`s shape library requires manual linking, often yielding rigid connections that don`t animate well. Our procedures offer smart connectors, auto-routing lines, and preset styles - creating fluid, updatable diagrams without rework, unlike defaults.
Support for data-driven updates via Numbers links keeps visuals current, a step up from static natives.
Excel with layered groupings for zoomable details and gradient fills for depth perception. Tips: Align via guides for symmetry, and use opacity for overlapping paths to avoid clutter.
Push boundaries with animated growth sequences for timelines or 360-degree rotations for cycle views. Pair with voiceover builds for narrated walkthroughs.
Illuminate ideas - pick a diagram template and present powerfully.
A VC firm used procedure-driven mind maps for pitch decks, securing funding through clear opportunity webs. Educators diagrammed ecosystem models with interactive labels, deepening student engagement.
Project leads flowcharted risk matrices, with color-coded probabilities that preempted delays. Artists conceptualized mood boards as Venn diagrams, layering inspirations uniquely.
Such applications prove procedures unlock diagrams` full potential, blending logic with artistry.
What diagram types are featured?
Flowcharts, Gantt, Venn, tree maps, and Sankey, with build guides.Handle large datasets?
Yes, with table imports and filterable nodes for scalability.Export options for diagrams?
SVG for web, EPS for print, or animated GIFs for social.Customize connector styles?
Adjust thickness, arrows, and curves in the format sidebar.Accessible for color-blind users?
Include pattern fills and high-contrast alternatives.Integrate with other Apple apps?
Link to Pages for reports or Numbers for live data.Visualize victory - secure your Keynote diagram template today.
Copyright © 2009-2026 ImagineLayout All rights reserved.