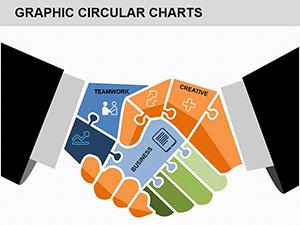
Unlock the potential of your strategies with planning diagrams optimized for PowerPoint, turning abstract plans into compelling, data-rich visuals. From org structures to process maps, these diagrams facilitate clear communication and informed decisions.
Aimed at analysts, managers, and presenters, the designs harness PowerPoint`s morphing transitions for seamless storytelling, ensuring your audience grasps interconnections effortlessly. Move beyond text-heavy slides to graphical narratives that resonate.
Tweak shapes, data links, and themes to fit your agenda, with built-in scalability for any deck size. Essential for quarterly reviews or innovation workshops, these diagrams drive engagement. Explore now and plot your progress.
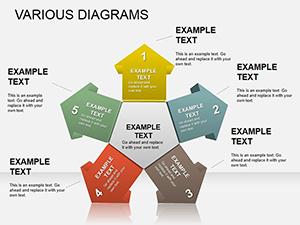
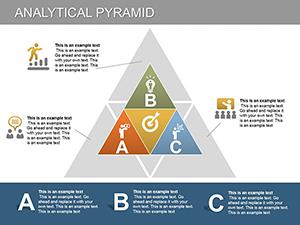
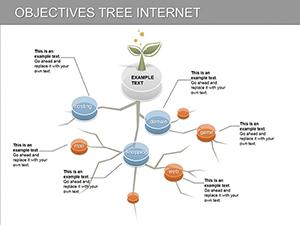
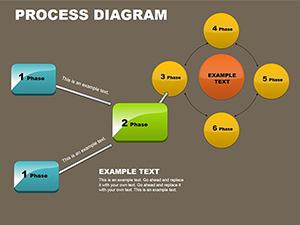
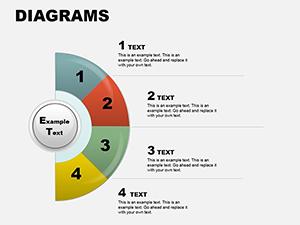
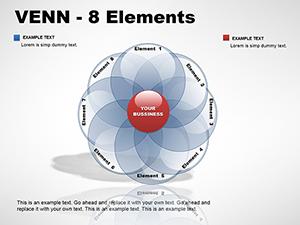

Surpassing PowerPoint`s SmartArt in flexibility, our diagrams include editable bezier curves and gradient fills for bespoke aesthetics. This granularity allows precise modeling, such as radial project phases radiating from core objectives.
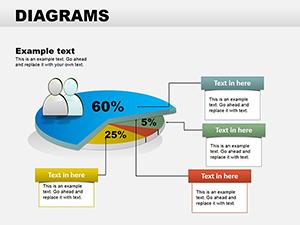
Financial advisors integrate them for portfolio allocations, using pie-segment evolutions to project growth scenarios dynamically. The compatibility with Excel data pulls ensures real-time accuracy.
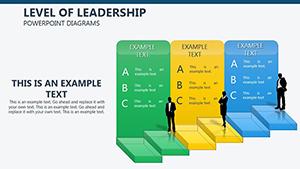
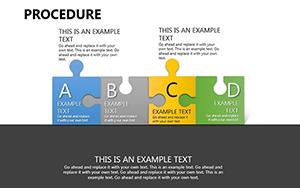
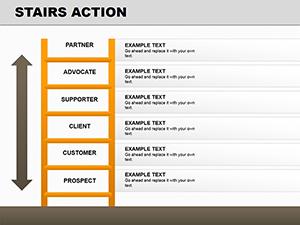
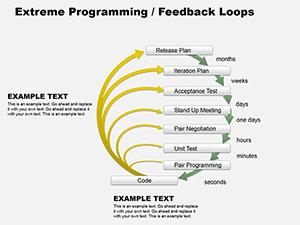
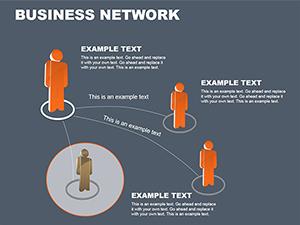
HR specialists outline succession plans with ladder diagrams, climbing through promotion tiers. In R&D, scientists map experiment sequences via sequential arrows, pinpointing variable influences.
Real estate developers employ site blueprints to phase constructions, syncing with zoning overlays for regulatory compliance.
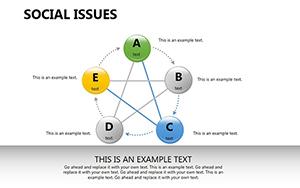
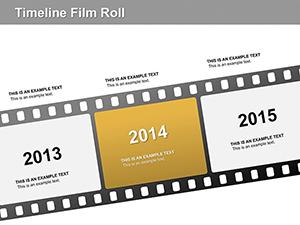
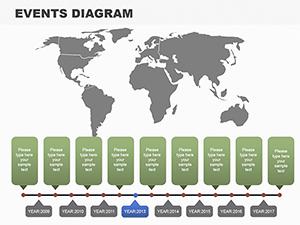
Linear flows suit chronological plans, whereas radial or matrix styles excel in exploratory phases, accommodating emergent insights fluidly.
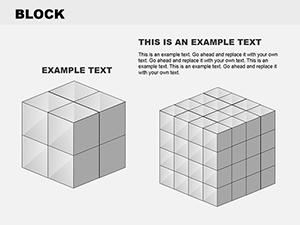
Basic inserts demand constant realignment; ours use master slide linkages for uniform updates across decks. Thematic icons and shadow effects add depth, elevating from functional to persuasive.
With WCAG-compliant contrasts and screen-reader tags, they promote equitable access, a step ahead of unrefined defaults. The animation presets streamline complex reveals without manual keyframing.
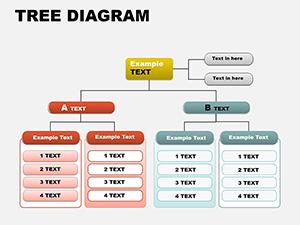
Layer elements hierarchically, grouping for batch edits - PowerPoint`s selection pane aids navigation. Employ morph transitions for evolutionary views, like expanding trees.
Embed QR codes for supplementary data, bridging slides to resources. Solicit beta feedback to hone clarity, iterating toward perfection.
Shape your narrative - acquire a diagram set and advance assuredly.
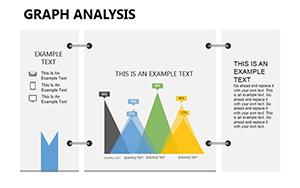
A logistics firm revamped route optimizations with heat-mapped diagrams, slashing delivery times by 18%. An NGO visualized aid distributions via layered choropleths, optimizing resource flows for greater reach.
Coaches adapted fitness progress radars for client reviews, motivating adherence through tangible metrics. Such applications affirm diagrams` transformative role in planning.
Insert via Linked Chart from Excel; refreshes pull updates, keeping visuals current without manual intervention.
Yes, with notes integrated below canvases, supporting seamless delivery cues alongside audience displays.
Export as EMF via Save As, preserving scalability for high-res prints or illustrations.
Morph for smooth changes, Wipe for directional flows - combine for layered storytelling effects.
Typically 5-8, covering orientations and styles to match diverse presentation needs.
Leverage these diagramming powerhouses to navigate complexities with confidence. Your strategic edge is one download away.
Copyright © 2009-2026 ImagineLayout All rights reserved.