Transform your business ideas into actionable visuals using our planning diagram templates for PowerPoint. Tailored for entrepreneurs, executives, and marketers, these designs make it easy to convey strategies through intuitive diagrams that captivate and clarify.
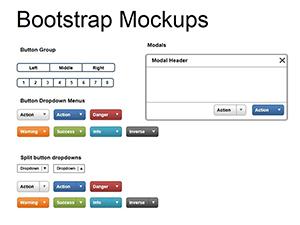
Featuring everything from pyramid structures for hierarchy breakdowns to cycle diagrams for process overviews, our templates are built with PowerPoint`s robust tools in mind. Scalable vectors and smart art integrations ensure professional results, even for beginners.
Ideal for pitch decks, annual reviews, or team alignments, they help distill complex plans into memorable slides. With vibrant yet professional color schemes, your presentations gain an edge in competitive settings. Peruse our library and select diagrams that align with your objectives.
Enhance your next meeting - download a template and illustrate your path to success right away.


These PowerPoint diagram templates for business planning provide a structured canvas that accelerates idea mapping. With embedded formulas for auto-calculating metrics and theme-syncing colors, they outperform ad-hoc creations in both speed and sophistication.
Executives value their role in simplifying forecasts, while startups use them for investor overviews, reporting quicker buy-in through visual storytelling.
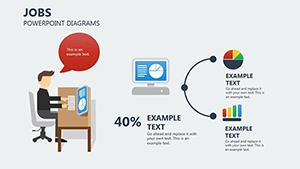
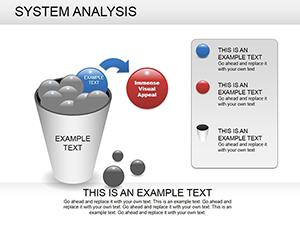
For startups, a revenue funnel diagram can spotlight growth stages, making financial projections pop. Venture capitalists respond well to such clarity, often citing visuals as pivotal in funding decisions.
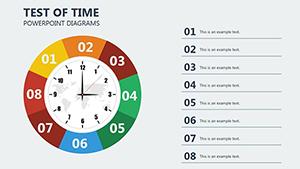
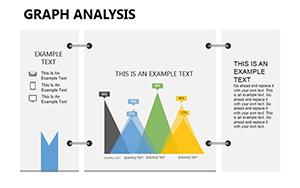
Marketing teams craft campaign roadmaps with timeline diagrams, tracking KPIs visually. In corporate settings, they aid budget allocations, offering at-a-glance insights for leadership.
Begin by duplicating slides, then populate with your data - PowerPoint`s alignment tools snap elements perfectly. Add hyperlinks for drill-downs to supporting details.
This method streamlines updates, keeping plans current.
PowerPoint`s built-in diagrams lack the depth for intricate planning; ours include multi-level branching and data-linked visuals, cutting design time significantly. Feedback highlights their superior adaptability, turning static slides into interactive narratives.
They also embed accessibility features like screen-reader tags, broadening reach.
Anchor diagrams to key narratives, using whitespace for focus. Test with audiences for comprehension, refining based on reactions. Integrate real-time data pulls for live updates during presentations.
Such practices, honed by presentation pros, amplify impact.
Position your business for growth - explore PowerPoint planning diagrams and download your ideal match.
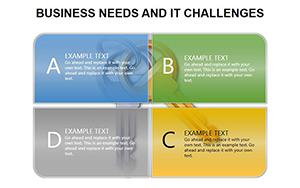
Funnels, timelines, and org charts lead for strategy overviews.
Yes, fully compatible for cloud-based editing and collaboration.
Link to Excel sheets for automatic chart refreshes.
Pre-set with options to build elements sequentially.
Certainly - adapt for event planning or academic projects.
Copyright © 2009-2026 ImagineLayout All rights reserved.