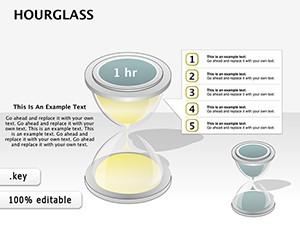
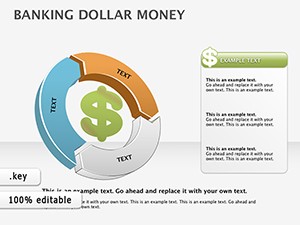
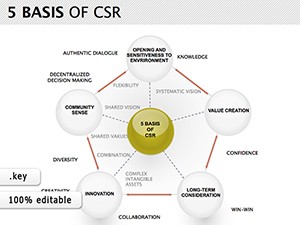
Capture the rhythm of progression with Period Keynote diagram templates, emphasizing phases in strategy, finance, and development. Hourglass sands for time-bound tactics or cycle wheels for recurring steps - these suit strategists sequencing initiatives, bankers flowcharting funds, or analysts diagramming CSR loops.
For phase-focused creators, they deliver elegant, clickable elements that reshape with your data, from 6-step cycles to tool integrations. Infuse sophistication with minimal tweaks, ensuring diagrams pulse with purpose on stage or screen.
Phase in precision - browse Period diagrams and diagram deliberately.
Thriving in boardrooms for CSR phase maps or classrooms for tool evolution cycles, these diagrams clarify complexities. In consulting, hourglasses time consultations, balancing urgency with depth.
Financial firms flowchart dollar drifts across periods, revealing flow frictions for fixes.
3D hourglasses drip decisions, marking phase flips for tactical turns.
Wheel segments spotlight sustainability stages, circling back to impact audits.
Basic shapes connect crudely, but Period diagrams weave phased narratives - interlocked cycles versus loose lines. They preset connectors for smooth flows, trimming alignment time from defaults. Icon libraries evoke eras, enriching over generic placeholders.
Collaboration thrives with versioned phases, tracking changes better than flat files.
Core charm: Phased modularity for evolving edits. Do: Sequence reveals chronologically, building suspense. Employ subtle spins on wheels for motion magic.
Link phases to tabs for navigable decks, ideal for lengthy logics.
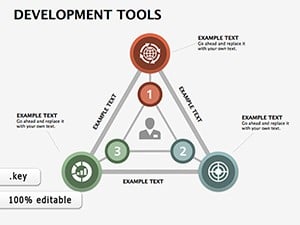
Diagram dev tools as period paths, branching innovations from base builds.
Diagram your drive - download a Period template and phase forward.
Precisely, with phased connectors for seamless stories.
Deep - reshape, recolor, and relink elements freely.
Smooth phase transitions, like sand shifts.
Yes, to Numbers for live updates.
Multi-phase packs for comprehensive coverage.
Diagrams here pulse with purpose, turning abstract phases into palpable progress. In agile ateliers, they loop learnings; in banks, they bank on clarity.
Amplify with audio cues per phase, syncing voice to visuals for immersive impact. The elegance lies in economy - one diagram distills decades.
Trace money motions across periods, eddying efficiencies from eddies.
Thus, Period diagrams propel presentations to phased perfection.
Copyright © 2009-2026 ImagineLayout All rights reserved.