Illuminate your data stories with percentage diagram templates optimized for PowerPoint. These sophisticated designs turn raw numbers into compelling narratives, perfect for showcasing market shares, progress metrics, or survey results.
Geared toward business professionals, marketers, and analysts, they deliver precision and polish with minimal effort. Harness PowerPoint`s morphing transitions to bring percentages to life on screen.
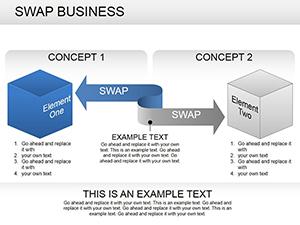
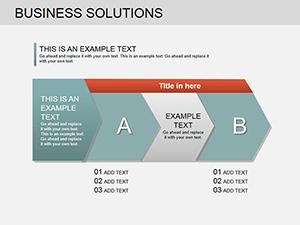
Choose from pie slices, radial gauges, or layered bars - each template is built for seamless customization and high-impact delivery.
Visualize success? Explore our percentage diagram templates for PowerPoint and impress every time.
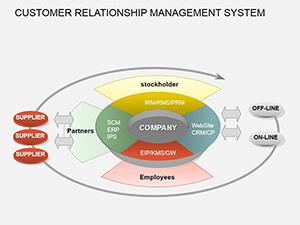

Percentage diagrams in PowerPoint excel at distilling complex datasets into digestible insights. They foster quick comprehension, ideal for executive summaries or client meetings. Our templates incorporate subtle gradients and icons for added depth.
Marketers track campaign ROI, while educators highlight achievement stats - versatility defines their appeal.
Superior to default charts with their bland aesthetics, these offer thematic consistency. Tip: Align colors with brand palettes for cohesive decks.
Layer icons over segments for thematic relevance, like gears for efficiency percentages. In pitches, animate fills to reveal data progressively, building suspense.
High-res vectors ensure scalability for large venues. Analysts praise the formula integration for real-time tweaks.
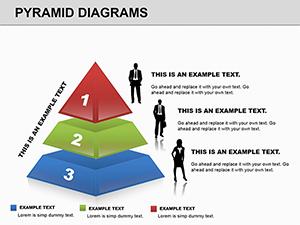
Pro results fast. Innovate with 3D extrusions for modern flair.
Data visuals cut misinterpretation by 50%. Embed tooltips for interactive PDFs, enhancing post-presentation value.
Accessibility features like descriptive alts included.
Chart your path to clarity - download PowerPoint percentage diagrams now.
Harness these tools for data dominance. Our collection is your gateway to persuasive slides.
Copyright © 2009-2026 ImagineLayout All rights reserved.