Demystify information with our PowerPoint diagram templates, engineered to make complexity accessible. Geared toward analysts, trainers, and executives, these visuals distill processes, hierarchies, and relationships into clear, impactful slides.
Leveraging PowerPoint`s native tools, each diagram is modular - rearrange segments, update labels, or infuse your data without breaking the flow. From funnel models tracking sales to radial charts depicting ecosystems, our library equips you to visualize success pathways effortlessly.
Benefits extend beyond aesthetics: these templates enhance comprehension, reduce miscommunication, and elevate decision-making. Professionals report quicker buy-ins after adopting structured diagrams. Peruse our options to identify the ideal fit for your analytical needs.
Diagrams in PowerPoint aren`t just add-ons; they`re narrative accelerators. Our templates empower users to convey multifaceted ideas succinctly, whether in boardrooms or webinars.
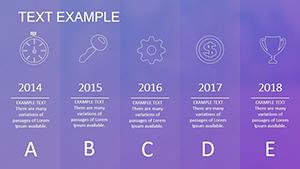
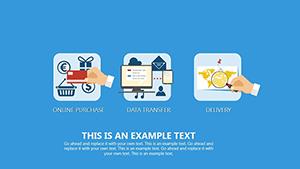
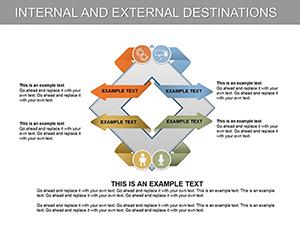
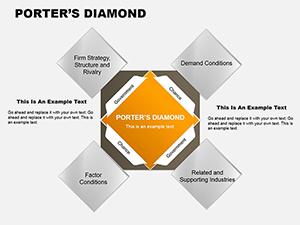
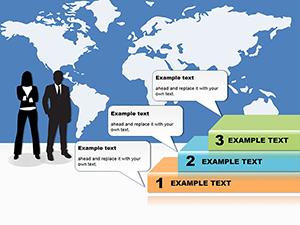
A consultant illustrating market penetration might choose a bubble diagram to plot variables, revealing insights at a glance. Trainers use process flows to guide trainees step-by-step, minimizing confusion. The result? Engaged stakeholders who retain and act on your insights.
Such integrations prove diagrams` versatility in driving clarity.
PowerPoint`s shape library suffices for basics, but advanced diagrams demand more. Defaults can lead to cluttered overlaps or static appearances, hindering dynamism. Our templates counter this with pre-linked connectors, scalable icons, and variant styles for thematic consistency.
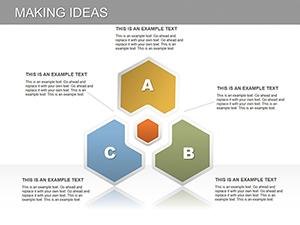
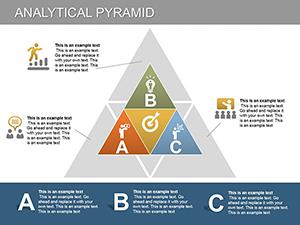
Picture a pyramid diagram for hierarchy - ours auto-adjusts layers for balance, unlike manual tweaks that disrupt. Embedded formulas link to Excel for live data pulls, keeping visuals current. This sophistication saves revision cycles and boosts reliability.
These approaches refine your diagrams into persuasive assets.
Tom, a data analyst, streamlined quarterly reviews with our cycle diagrams, cutting presentation time by 30% while increasing Q&A depth. In nonprofits, coordinators visualized fund flows, attracting more donors through transparent storytelling. These narratives affirm the templates` transformative potential.
Examine previews to align with your diagramming goals.
Step up your visual game - select a PowerPoint diagram template and craft slides that resonate and resolve.
Insights to address common hurdles.
Copyright © 2009-2026 ImagineLayout All rights reserved.