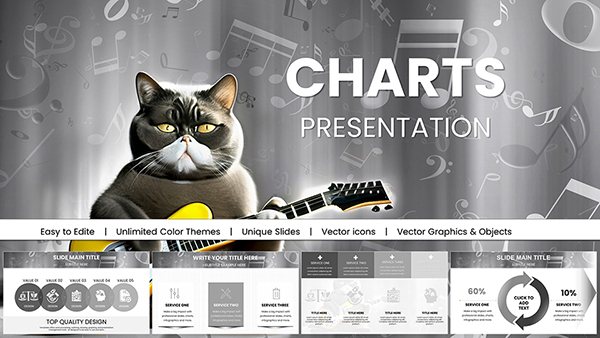
Streamline your performance tracking with our Monitors PowerPoint charts, engineered for monitoring vital business indicators. From KPI dashboards to progress gauges, these visuals capture trends and anomalies at a glance, supporting proactive decision-making across departments.
Geared toward analysts, project managers, and operations leads, the templates offer drag-and-drop simplicity within PowerPoint. Crisp icons, scalable gauges, and color-coded alerts make complex data digestible, fostering a culture of transparency and accountability.
Whether for monthly reviews, compliance audits, or goal alignments, these charts turn numbers into narratives. Explore our Monitors PowerPoint collection and integrate monitoring mastery into your workflows today.
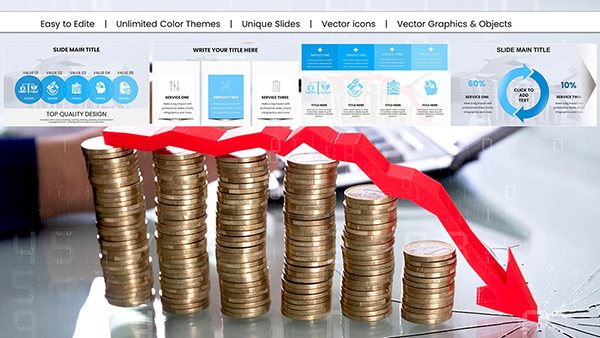


Monitors PowerPoint charts are indispensable in operational hubs. Finance teams deploy them for budget variance tracking, using bullet graphs to spotlight overruns early. A logistics firm slashed delays by 18% after visualizing fleet utilization via our real-time gauges.
HR applications include employee engagement monitors, with radial dials charting satisfaction scores over time. In healthcare, admins track patient flow metrics, ensuring resource optimization with heatmap overlays.
PowerPoint`s stock charts often lack specificity for monitoring, resulting in generic lines that obscure trends. Our versions introduce specialized widgets like speedometers and thermometers, with conditional formatting for instant red-flagging. Defaults require add-ins for interactivity; ours are native, ensuring smooth playback.
With embedded formulas for auto-calculations, they reduce errors compared to manual setups, delivering reliable insights faster.
Set thresholds visually with gradient fills, link to external sheets for live feeds, and schedule automated updates via PowerPoint`s refresh features. Layer multiple monitors on a master slide for comprehensive overviews.
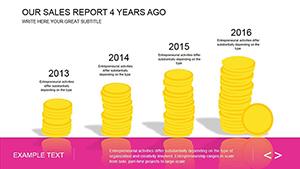
Innovate by syncing charts with IoT data for live factory floor monitors, or create narrative arcs where monitors evolve across slides to show quarterly progress. A marketing agency used animated counters to demo campaign ROI, captivating clients with tangible gains.
For remote teams, export as interactive PDFs with clickable drill-downs, extending utility beyond presentations.
Browse and download Monitors PowerPoint charts to fortify your data storytelling arsenal.
Armed with this knowledge, elevate your monitoring game - start downloading now.
Copyright © 2009-2026 ImagineLayout All rights reserved.