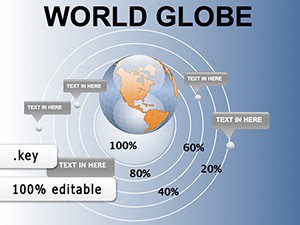
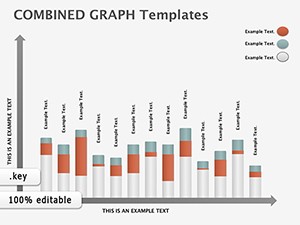
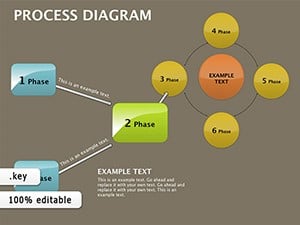
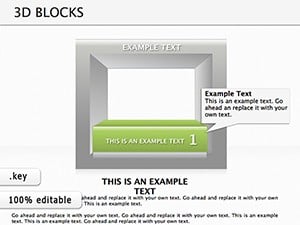
Effective data visualization is essential for impactful presentations, and our collection of monitoring diagrams for Keynote delivers exactly that. Whether you're reporting quarterly results, tracking project milestones, or analyzing performance metrics, these templates help you present complex information clearly and confidently.
Go beyond basic charts with professional-grade designs featuring smooth animations, customizable gauges, progress bars, and dashboard layouts. Each diagram is fully editable, allowing you to adjust colors, data, and layout to match your brand perfectly.
Designed with trends in mind, these ready-to-use templates save hours of design time while ensuring your slides look polished and contemporary. Ideal for business professionals, managers, and analysts who want to impress stakeholders without the hassle.

Default Keynote charts are functional but often lack the visual sophistication needed for high-stakes presentations. Our monitoring diagrams are crafted by experienced designers and include advanced features like layered elements, pre-built animations, and high-resolution graphics that maintain clarity on any display.
These versatile templates shine in numerous scenarios:
Our diagrams offer superior customization, professional aesthetics, and engaging animations that keep audiences focused. You'll achieve a custom-branded look quickly, without needing advanced design skills.
Ready to create compelling monitoring slides? Browse our full collection and download your favorite monitoring diagrams today!
Yes, all templates are tested and optimized for current Keynote versions on Mac, iPad, and iPhone.
Absolutely - every element is fully editable, from colors and fonts to data values and layout.
Many include professional build-in and transition animations to make your data reveal more engaging.
Yes, we offer free options alongside premium templates with more advanced features.
Copyright © 2009-2026 ImagineLayout All rights reserved.