Empower your financial storytelling with money PowerPoint templates that combine robust data handling with captivating aesthetics. Ideal for dissecting market trends, pitching budgets, or reporting earnings, these templates turn numbers into narratives that drive action.
From C-suite executives to sales teams, they`re built for Windows and cross-platform compatibility, featuring slide masters for consistent theming and co-authoring support for team refinements.
With embedded SmartArt for quick visuals and transition libraries for smooth flows, creating deck after deck becomes effortless. Focus on your message while our designs handle the polish. Delve into the assortment and power up your presentations.
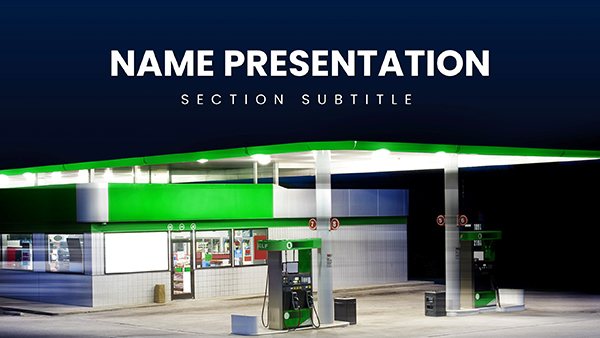
Revitalize Your Presentations with Refuel a Car PowerPoint Template for Presentation
ID: #PP03729
$12.00
(1005)
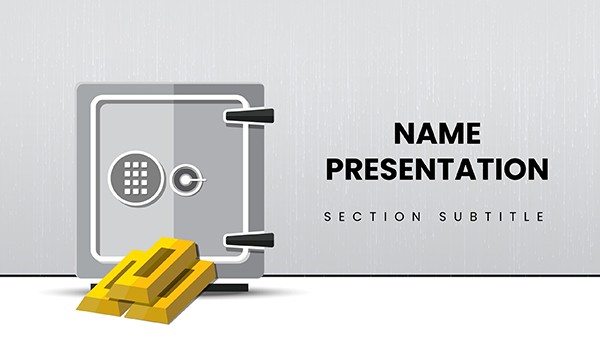
Bank Safe PowerPoint Template: Locking in Financial Fortitude
ID: #PP03711
$12.00
(244)
POS Terminal Online Payments and Credit Card PowerPoint Template
ID: #PP03644
$12.00
(946)
Chart the Golden Path to Economic Clarity with the Gold Spot Price PowerPoint Template
ID: #PP03637
$10.00
(979)
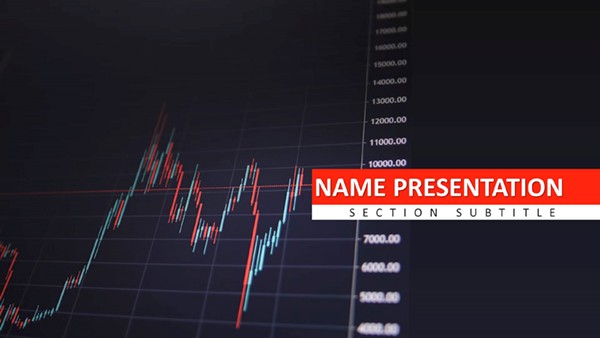
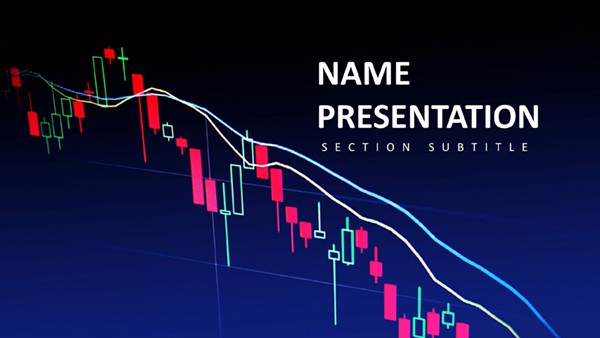
Trend Line Graph PowerPoint Template: Decode Market Movements with Clarity
ID: #PP03621
$12.00
Diverse Uses for Money PowerPoint Templates
PowerPoint`s ubiquity makes these templates go-to for financial discourse. Auditors showcase compliance via themed timelines, while traders analyze portfolios with heatmap integrations.
Consider a sales VP unveiling quarterly results: builds animate profit curves, hyperlinks drill into segments, and notes guide verbal elaborations.
Executive and Sales
Budget Reviews: Modular slides for variance analysis and adjustments.
Investment Pitches: Narrative arcs from problem to funded solution.
Performance Reports: KPI dashboards with conditional formatting.
Training and Marketing
Trainers simulate trading floors with interactive quizzes, marketers forecast campaign yields via projection slides.
Why Beyond Standard Templates
Stock PowerPoint files are plain; ours infuse finance flair with bill icons, chart presets, and VBA macros for dynamic calcs, plus accessibility tags for broader reach.
Collaboration shines with OneDrive syncing, outpacing local edits.
Signature Perks and Strategies
Perks: reusable content libraries, 16:9/4:3 ratios, and high-res placeholders. Strategies - storyboard first, use 24pt fonts min, and embed videos for demos.
Imaginatively, a chef budgets menus with ingredient cost pies, or a gamer monetizes streams via funnel metrics.
Present with power. Download and deploy your ideal template.