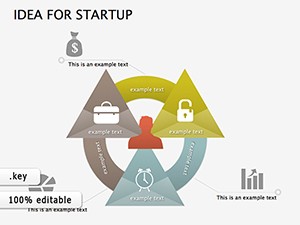
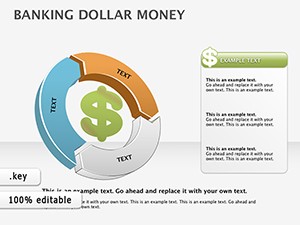
Navigate the intricacies of finance with our money Keynote diagrams, where complex processes meet elegant design. These tools are essential for mapping out workflows like approval chains, risk matrices, or asset allocations in a visually compelling manner.
Geared toward project managers, strategists, and financial planners on Apple devices, they utilize Keynote`s vector precision for sharp, scalable illustrations that withstand zooming and exporting.
Enhance your ability to explain interconnections - such as how expenses influence profitability - with diagrams that guide the eye logically. Our library promotes understanding over mere decoration. Peruse the options and integrate sophisticated visuals into your Keynote projects today.

Diagrams clarify the `how` behind financial numbers, powering applications from compliance training to merger planning. Compliance officers diagram regulatory flows, ensuring teams grasp reporting timelines.
Think of a bank executive outlining loan processing: a swimlane diagram assigns roles across departments, with decision diamonds for approvals, making inefficiencies visible.
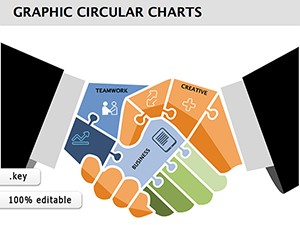
Consultants deploy fishbone diagrams for cost overrun root causes, while developers prototype budgeting apps via wireframe flows.
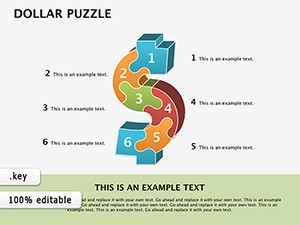
Keynote stocks basic shapes, but our finance-tuned diagrams add connectors with money labels, auto-routing lines, and thematic fills like metallic golds for value nodes, elevating professionalism.
They facilitate collaboration with shared editing links and version history, unlike static defaults.
Features include grouped smart shapes for easy manipulation and export to PDF for handouts. Tips: use consistent arrow directions for flow logic, group related elements, and add shadows sparingly for depth.
Creatively, an event planner diagrams sponsorship tiers as pyramid structures, or a researcher maps economic policy effects in causal loops.
Map out your financial future. Download a diagram and diagram your path forward.
Yes, share via iCloud for real-time edits with team members.
Fully - adjust curves, weights, and endpoints dynamically.
Double-click shapes; formatting tools match diagram style.
Export as images for integration into multimedia projects.
Copyright © 2009-2026 ImagineLayout All rights reserved.