Shape your vision with our business model diagram templates for PowerPoint, designed to articulate strategies, canvases, and frameworks with professional finesse. These are indispensable for entrepreneurs, consultants, and executives mapping out growth paths.
From lean canvases to SWOT matrices, our diagrams distill intricate concepts into structured visuals that drive discussions and decisions. They foster alignment, turning abstract ideas into tangible plans.
Effortless to adapt with PowerPoint`s tools, they fit seamlessly into pitch decks or whitepapers. Whether launching startups or refining operations, gain clarity and conviction. Delve into our assortment and model success.
Business model diagrams in PowerPoint crystallize theoretical frameworks into practical tools, enabling teams to dissect and reconstruct operations. They bridge gaps between vision and execution, sparking innovative refinements.
Startups employ them for value proposition mapping, while corporations analyze competitive landscapes. The structured format encourages holistic thinking, revealing synergies overlooked in linear docs.
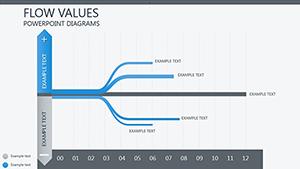
Standard PowerPoint lines pale; our models use connectors and fills for relational depth.
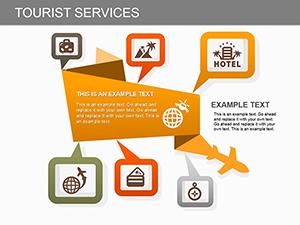
Consultants craft Osterwalder canvases, segmenting customer segments and channels visually. Investors review pitch diagrams highlighting key partners and costs. Non-profits model impact pathways, linking activities to outcomes.
These applications demystify complexity, accelerating buy-in.
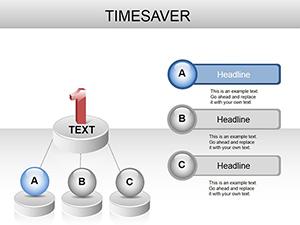
Iterate collaboratively via comments.
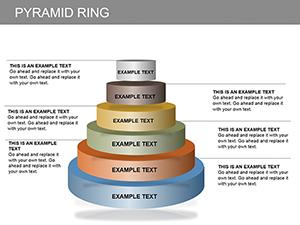
Populate with real data early to test assumptions, and solicit feedback loops. Use animations to unveil layers progressively in reviews.
Such rigor ensures models evolve with your business.
Blueprint your future - grab templates now.
Model with confidence using expert designs.
Copyright © 2009-2026 ImagineLayout All rights reserved.