Map out your mission`s blueprint using our Keynote diagram templates, ideal for consultants, educators, and coordinators. These tools feature interconnected nodes, hierarchical structures, and process arrows, all styled to reflect purpose and progression.
From outlining team roles to visualizing project phases, the diagrams promote logical flow and easy comprehension. With shape libraries and auto-align features, building complex visuals becomes intuitive, empowering you to communicate strategies with precision.
Enhance workshops or reports with these assets. Review the assortment to choose diagrams that suit your scope, and illustrate success.
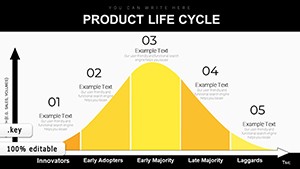
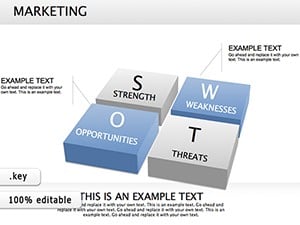
Mission diagrams in Keynote use lines and shapes to connect dots - literally - turning vague plans into structured roadmaps. Think cycle diagrams for iterative goals or tree maps for branching objectives, each enhancing spatial understanding. Our library boasts 35+ variants, editable with Keynote`s robust tools for fluid adjustments.
A startup might diagram venture milestones as a winding path; the curvature adds narrative flair. Precision connectors ensure professional polish.
Unlike Keynote`s default shapes, our mission diagrams come pre-themed, saving setup time and ensuring visual harmony - defaults often require manual styling, leading to inconsistencies. Smart guides snap elements perfectly.
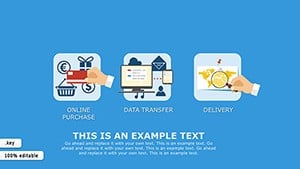
Unique application: Animate diagram builds to simulate growth, like branches extending in a tree. Or, hyperlink nodes to sub-slides for interactive explorations.
Diagram your destiny. Select a Keynote mission diagram now and structure brilliance.
With collaborative Keynote features, diagrams now support real-time edits, perfect for remote mission workshops. 2025 trends favor interactive embeds, like QR-linked details, which our templates accommodate via hotspots.
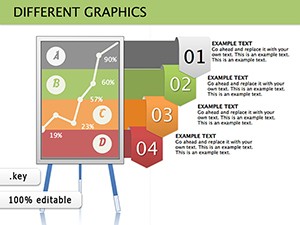
Trainers employ them for skill development flows, sequencing learning modules visually. The extensible nature allows fusing with charts for hybrid intel.
Keynote`s integration trumps standalone apps for presentation flow, though exports to SVG enable broader use.
Visualize victory. Discover more mission Keynote diagrams for mapped excellence.
Flowcharts, mind maps, Venn, and hierarchical trees tailored to mission contexts.
Fully vector-editable, with color, size, and text tweaks via drag-and-drop.
Yes, path animations trace connections, buildable per segment.
Scalable org charts handle 100+ nodes without lag.
PDF, PNG, and animated GIF for versatile sharing.
Import from Lucidchart or export to Visio seamlessly.
Copyright © 2009-2026 ImagineLayout All rights reserved.