Transform your slides into captivating journeys with our professionally designed map PowerPoint templates. Perfect for business analysts educators marketers and travel enthusiasts these templates make your data visually engaging and easy to understand.
Highlight regions trends and key locations effortlessly using layered maps customizable pins and integrated charts. Save time with ready-to-use layouts that elevate reports pitches and lessons.
Paradise Awaits: Beach Island Vacation Template Magic
ID: #PP01065
$10.00
(893)
Japan Country PowerPoint Template: Captivate with Cultural Precision
ID: #PP00695
$10.00
(420)
Rome City PowerPoint Template
ID: #PP00576
$10.00
(58)
New York City PowerPoint Template
ID: #PP00573
$10.00
(930)
Adventure Quest PowerPoint Template Pack
ID: #PP00426
$10.00
(798)
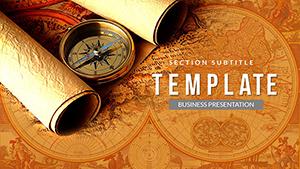
Voyage Treasure Hunt PowerPoint Template
ID: #PP00416
$10.00
(712)
Mobile Presentation PowerPoint Template
ID: #PP00407
$5.00
(540)
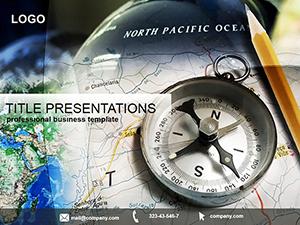
Chart Your Course with Geographic Mastery
ID: #PP00401
$10.00
(72)
Travel Agency PowerPoint Template
ID: #PP00374
$9.00
(140)
Auto Trip PowerPoint Template
ID: #PP00358
$10.00
(72)
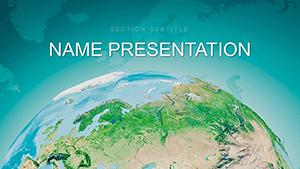
Geography Revision PowerPoint Template
ID: #PP00357
$10.00
(752)
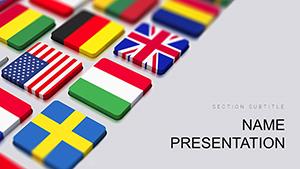
Adventurous Search Country PowerPoint Template
ID: #PP00293
$10.00
(749)
Family Travel PowerPoint Template: Chart Your Next Adventure
ID: #PP00277
$9.00
(380)
Paris Travel Guide PowerPoint Template: Eiffel Your Escapade
ID: #PP00274
$10.00
(697)
Map Travel PowerPoint Template Essentials
ID: #PP00265
$10.00
(1159)
Chart Travel Paths with Dynamic PPT
ID: #PP00221
$10.00
Why Choose Map PowerPoint Templates
Maps are essential for visual storytelling in presentations. Our templates support diverse use cases from corporate sales reports to classroom geography lessons.
Business reports: Regional analysis and market penetration insights
Education: Annotate historical events and environmental changes
Marketing: Visualize customer distribution and campaign reach
Travel: Highlight routes destinations and attractions
Advantages Over Default PowerPoint Maps
Unlike standard maps our templates offer high-resolution editable vectors coordinated color palettes and built-in animations for professional storytelling.
Creative Tips and Best Practices
Import data into Excel-linked charts for dynamic updates
Customize colors to match your brand
Limit layers to 5-7 for clarity
Add hyperlinks for interactive presentations
Start Your Mapping Adventure
Download today and turn your presentations into visually compelling narratives that engage and inform your audience.
Frequently Asked Questions
What map projections are available in these PowerPoint templates?
Templates include Mercator Robinson and azimuthal options all fully editable.
Can I add custom locations to the maps?
Yes use drawing tools or import shapefiles to add unique pins and regions.
Are the templates suitable for large audiences?
Designed for high-resolution displays they work well in conferences and seminars.
How do animations work with map elements?
Pre-set fades and paths animate pins and data points sequentially.
Do they support data import from Excel?
Yes linked tables update maps dynamically from your spreadsheets.