Management PowerPoint Diagrams
Effective management needs clear structure. Our management diagram templates help leaders communicate hierarchy, timelines, and strategies with confidence.
More than 150 specialized designs cover organizational charts, project timelines, SWOT analysis, decision trees, and process flows - all fully editable.
Perfect for team updates, strategic planning, and performance reviews in.
Save time and present with authority.
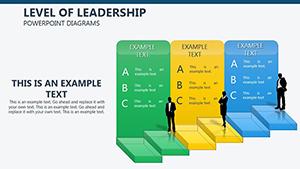
Leadership Training Diagrams - Editable PPTX | ImagineLayout
ID: #PD00023
Active Directory PowerPoint Diagrams: Navigating Networks with Ease
ID: #PD00176
Financial Risks PowerPoint Diagrams Template: Download PPTX
ID: #PD00155
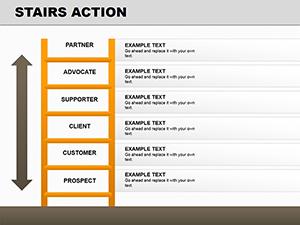
Stairs Action PowerPoint Diagrams: 16 Dynamic Slides
ID: #PD00141
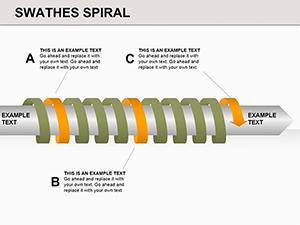
Swathes Spiral PowerPoint Diagrams Template
ID: #PD00137
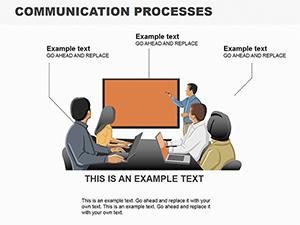
Communication Processes PowerPoint Diagrams: Download Presentation
ID: #PD00106
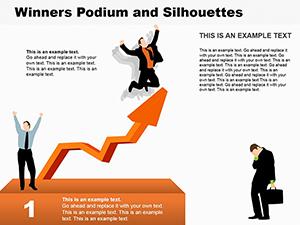
Winners Podium Silhouettes PowerPoint Template
ID: #PD00103
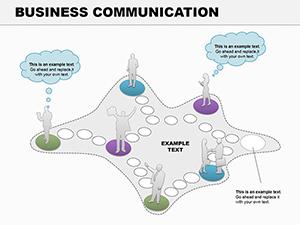
Business Communication PPT Diagrams: Weave Words into Impact
ID: #PD00080
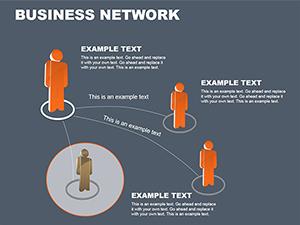
Business Network PowerPoint Diagrams Template: Download PPTX
ID: #PD00071
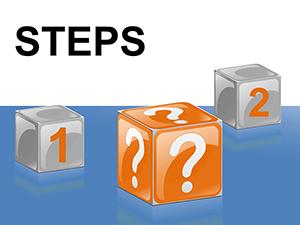
Steps PowerPoint diagrams - 3D, Business Models, Cubes
ID: #PD00041
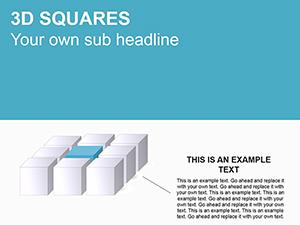
3D Squares & Cubes PowerPoint Diagrams: Add Depth to Your Visuals
ID: #PD00031
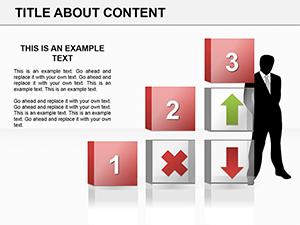
Progressive Business Process PowerPoint Diagrams
ID: #PD00024
How Management Diagrams Drive Better Decisions Visual structure helps teams align on roles, responsibilities, and timelines, reducing confusion and improving execution.
Advantages of Our Management Templates Clean hierarchical org charts Detailed Gantt and timeline views Strategic frameworks like SWOT and fishbone Professional color schemes Easy updates as teams change Common Use Cases Team Structure: Show reporting lines and roles.Project Planning: Track milestones and dependencies.Strategy Sessions: Present analysis frameworks.Performance Reviews: Visualize goals and results.Tips for Strong Management Visuals Keep org charts simple - one level per slide if large Use progress indicators on timelines Color-code departments or priority levels Update regularly to reflect current structure Strengthen your leadership presentations - explore our management diagrams and download the ones you need today.
Frequently Asked Questions Can I add or remove positions in org charts? Yes - each box is fully editable and duplicatable.
Are Gantt chart templates included? Yes - several detailed timeline and Gantt designs.
Do templates support team photos? Many include placeholder frames for photos or avatars.
Are they editable in PowerPoint? Completely - no special software needed.
Can I change the color scheme? Yes - easily match your company branding.