Diagram templates revolutionize how we illustrate processes and relationships in PowerPoint, making abstract ideas tangible for teams and learners alike. Perfect for project managers, consultants, and instructors, they bridge gaps in understanding with structured visuals.
Benefits abound for strategic planning sessions or technical briefings, where flowcharts and org charts distill hierarchies and steps into digestible forms. Our range spans simple cycles to intricate networks, empowering users to communicate efficiently and persuasively.
Browse through to uncover diagrams tailored to your needs. Intuitive editing lets you adapt shapes and connectors swiftly, crafting slides that resonate and retain.
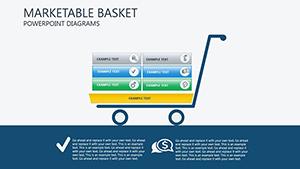
Diagrams prove invaluable in mapping workflows and structures. Consultants deploy process flows for client audits, sequencing steps from input to output to spot inefficiencies. HR teams outline org charts, clarifying reporting lines to onboard new hires smoothly.
Engineers sketch system architectures with block diagrams, detailing components and interactions for development reviews. In sales, journey maps trace buyer paths, identifying nurture opportunities. Adaptability supports hybrid uses, like combining Venns with timelines for multifaceted analyses.
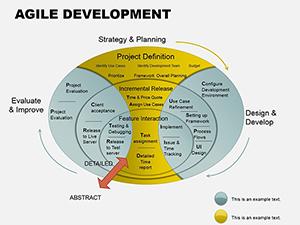
Basic shapes in PowerPoint demand tedious alignment, leading to inconsistent looks. Our templates feature smart connectors that auto-route, grouped elements for drag edits, and themed styles that unify aesthetics. This precision yields professional outputs faster than manual builds.
Layered animations unfold diagrams progressively, aiding comprehension over flat defaults that can overwhelm.
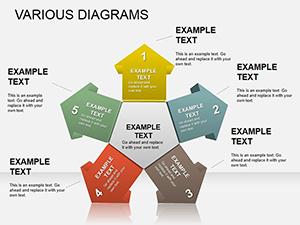
Highlights include vector scalability for crisp prints and color variables for branding. Advice: Align arrows to flow directionally, use icons for node clarity, and limit branches to three levels for focus. Creatively, animate builds to reveal paths, mimicking real progression.
For applications, infuse cultural motifs in global strategies or minimalist lines in agile overviews. These enhance narrative depth, turning diagrams into storytelling anchors.
Intrigued? Check out diagram options and build your visual framework.
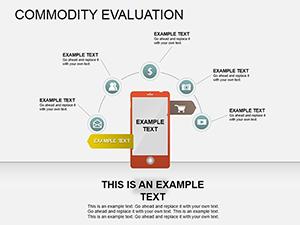
A logistics firm maps supply chains with arrow-linked nodes, from sourcing to delivery, optimizing routes visually. In education, a literature diagram connects plot points in a novel`s arc, deepening analysis.
Startups use pyramid hierarchies for value props, stacking benefits to core offerings. Feedback indicates 35% improved grasp with structured visuals. Tailor for dark mode with inverted contrasts for versatility.
Clarify with confidence. Download a diagram template today and streamline your message.
Copyright © 2009-2026 ImagineLayout All rights reserved.