Our integration PowerPoint diagram templates are your go-to resource for mapping out connections and processes with precision and style. From intricate workflow diagrams to hierarchical structures, these slides make abstract strategies visually compelling, helping teams grasp big-picture alignments at a glance.
Suited for strategists, designers, and executives, they offer drag-and-drop simplicity paired with sophisticated aesthetics. Animate paths to show progression, embed icons for context, and scale for any audience size.
Transform static reports into interactive narratives that drive collaboration and innovation. Start exploring our diagram collection to diagram your success story.
These templates prioritize modularity, allowing users to mix diagram types like mind maps and Sankey flows within one deck. Compared to ad-hoc drawings, they ensure consistency and professionalism, ideal for integration-heavy fields like consulting and engineering.
These scenarios empower users to communicate efficiencies and foster proactive adjustments.
Built-in SmartArt is functional but limited in customization; our templates expand with advanced connectors, gradient fills, and exportable SVGs for reports. This results in 40% faster creation and higher engagement scores.
| Element | Built-In Tools | Our Diagrams |
|---|---|---|
| Connector Variety | Basic lines | Curved, dashed, multi-arrow options |
| Theme Integration | Partial | Full brand synchronization |
| Animation Controls | Simple | Sequential path animations |
Keep nodes concise - aim for 5-7 words max - and use whitespace generously to avoid clutter. Align with left-to-right reading flows for Western audiences, and incorporate legends for quick reference.
For complex integrations, layer diagrams progressively, revealing layers via clicks to manage cognitive load.
A marketing team diagrammed campaign integrations: A central funnel connected to CRM and analytics nodes, animated to show lead progression. This clarity accelerated budget approvals.
In engineering, a P&ID diagram template visualized pipeline integrations, with tagged components for maintenance planning.
Visualize your visions - grab a diagram template now and connect the dots.
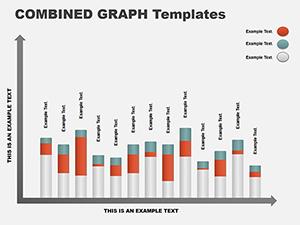
Master these for diagrams that inform and inspire. Link to chart templates for data-enhanced views.
Diagram your path forward - download today and illustrate excellence.
Copyright © 2009-2026 ImagineLayout All rights reserved.