Information PowerPoint Diagrams

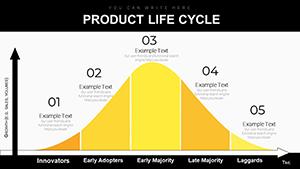
Information PowerPoint diagrams templates distill vast data into coherent visuals, empowering analysts, reporters, and executives to communicate findings persuasively. These adaptable graphics - from flowcharts to matrices - fit any narrative, enhancing credibility and clarity.

Aimed at data-driven professionals, they feature drag-and-drop components, auto-formatting, and legend builders to save time while maximizing impact. Whether unpacking market trends or operational flows, they make intricacies accessible.

Native to PowerPoint, they leverage morph transitions for seamless evolutions between states. Our curated set spans styles for every context. Download a diagram pack today and diagram your success story.


View by: Last Added | Most Popular
  • like 3
    (264)
    Navigate Market Waters: PowerPoint Diagrams for Life Cycle Mastery
    ID: #PD00220
    $16.00
  • like 5
    (32)
    Online Shopping PowerPoint Diagrams: Transform Data into Sales Wins
    ID: #PD00206
    $18.00
  • like 3
    (35)
    Information PowerPoint Diagrams: Clarity in Every Curve
    ID: #PD00205
    $22.00
  • like 4
    (446)
    Population PowerPoint Diagrams: Mapping Humanity's Mosaic
    ID: #PD00204
    $15.00
  • like 4
    (197)
    Social Issues PowerPoint Diagrams Template
    ID: #PD00196
    $23.00
  • like 3
    (65)
    Access And Information Protection PowerPoint Diagrams
    ID: #PD00187
    $25.00
  • like 3
    (135)
    Table Descriptions PowerPoint Template: Craft Compelling Data Narratives
    ID: #PD00183
    $16.00
  • like 5
    (1110)
    Various Data PowerPoint Template: Infuse Your Presentations with Visual Intelligence
    ID: #PD00182
    $20.00
  • like 2
    (771)
    Active Directory PowerPoint Diagrams: Navigating Networks with Ease
    ID: #PD00176
    $22.00
  • like 2
    (1196)
    Development Tools PowerPoint Diagrams: Streamline Your Project Visions
    ID: #PD00153
    $18.00
  • like 5
    (1123)
    Project Schedule PowerPoint Template: 8 Pro Slides
    ID: #PD00144
    $16.00
  • like 2.1
    (113)
    Social Network PowerPoint Diagrams: Connect Ideas Visually
    ID: #PD00120
    $22.00
  • like 4
    (104)
    Flower Triangle Business Concept PPT Template
    ID: #PD00087
    $22.00
  • like 4
    (6)
    Versatile PowerPoint Diagrams: Elevate Your Presentations with Precision
    ID: #PD00059
    $22.00
  • like 2
    (236)
    Versatile Collection: PowerPoint Diagrams Pack
    ID: #PD00056
    $22.00


Master Data Storytelling with Diagram Excellence

Information diagrams in PowerPoint transcend static images by embedding logic that updates dynamically, far from the clunky defaults that frustrate users. They employ semantic grouping for intuitive navigation.

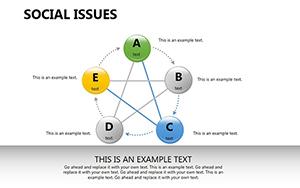
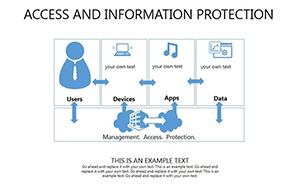
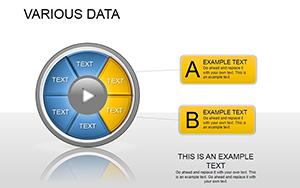
Analysts chart KPIs with radial spokes, journalists sequence events in sequential arrows, and ops teams model supply chains via node networks.

Targeted Use Cases for Diagram Deployment

  • Annual Reports: Aggregate metrics in dashboard collages for executive summaries.
  • Proposal Pitches: Illustrate value props with before-after comparatives.
  • Training Manuals: Break down protocols into step pyramids.
  • Research Papers: Map methodologies with interconnected bubbles.

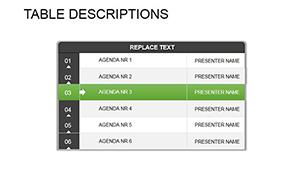
They excel with pivot-table links and conditional formatting, delivering 40% faster insights than manual builds.

Diagram Design Principles

  1. Prioritize Hierarchy: Use size and position to denote importance.
  2. Limit Elements: Cap at 7 per view to avoid overload.
  3. Color Code Logically: Assign palettes to categories for instant recognition.
  4. Test Iteratively: Solicit feedback on clarity before finalizing.

Adopt these for diagrams that inform decisively. Choose a template and populate with your data forthwith.

Innovative Ways to Leverage Diagrams

Connect to Power BI for live feeds, or animate paths for process simulations. A finance team reduced errors by 32% with automated Sankey flows. For accessibility, include descriptions and high-contrast variants.

Fuse diagram types - Venn-process hybrids for overlap analyses. Render in 4K for immersive displays.

Diagrams herein catalyze comprehension, turning numbers into narratives. Survey our assortment for matches.

Illustrative Wins with Information Visuals

A media outlet clarified election data via alluvial diagrams, spiking engagement. A logistics firm optimized routes with graph models, saving costs. These highlight diagram potency.

With reusable masters, standardize across decks. Supplement with data viz extensions.

Frequently Asked Questions

Do diagrams auto-update from sources?

Yes, via linked tables or OLE objects for real-time refreshes.

Are they printable?

Vector quality ensures sharp prints at any scale.

How to export for web?

Save as SVG or animated GIF for online embedding.

Can non-designers use them?

Guided tutorials make pro results achievable quickly.

What`s the variety in styles?

From minimalist lines to ornate illustrations, 30+ options.

Include accessibility features?

Built-in alt tags and color-blind modes standard.