Information Keynote Diagrams

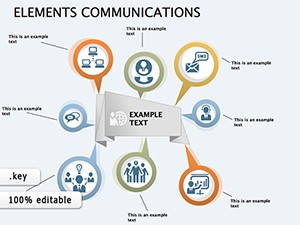
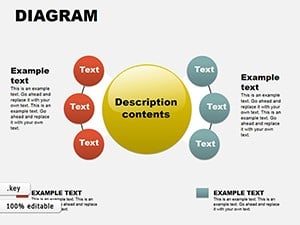
Convey precision with our information-rich Keynote diagram templates, engineered for analysts, reporters, and communicators unpacking multifaceted topics. These diagrams employ nodes, arrows, and clusters to delineate relationships, turning dense info into navigable maps.

Leveraging Keynote`s vector tools, they allow drag-and-drop refinements and conditional formatting based on data thresholds. From entity-relationship models to process infographics, they suit any depth of detail.

For boardrooms, webinars, or whitepapers, these templates distill overload into enlightenment, aiding comprehension across expertise levels. With scalable resolutions and export-ready formats, they`re your ally in clear conveyance. Diagram your details starting here.


View by: Last Added | Most Popular
  • like 2
    (1119)
    Master Your Product's Journey: Product Life Cycle Keynote Diagrams
    ID: #KD00220
    $16.00
  • like 2
    (874)
    Collective Keynote Diagrams for Pro Presentations
    ID: #KD00212
    $16.00
  • like 2
    (474)
    Testing Web Keynote Diagrams Template | Download Presentation
    ID: #KD00208
    $16.69
  • like 4
    (814)
    Professional Online Shopping Keynote Diagrams Template | Download Now
    ID: #KD00206
    $18.00
  • like 3
    (121)
    Information Keynote Diagrams Template
    ID: #KD00205
    $20.00
  • like 3
    (330)
    Population Keynote Diagrams Template
    ID: #KD00204
    $15.00
  • like 3
    (337)
    Creative Keynote Diagrams Template
    ID: #KD00202
    $22.00
  • like 4
    (392)
    Jobs Keynote Diagrams for Career Pros
    ID: #KD00201
    $14.00
  • like 2
    (837)
    Access And Information Protection Keynote Diagram Template
    ID: #KD00187
    $25.00
  • like 5
    (103)
    Creativity with Stunning Table Descriptions Keynote Diagrams
    ID: #KD00183
    $16.00
  • like 3
    (202)
    Business Solutions Keynote Diagrams Template for Presentation
    ID: #KD00163
    $23.00
  • like 4
    (798)
    Time Management Keynote Diagrams: Presentation Template
    ID: #KD00162
    $22.00
  • like 3
    (56)
    Supply Pipe Keynote Diagrams: 3D Visuals for Operational Flows
    ID: #KD00145
    $28.00
  • like 5
    (525)
    Lens Division Keynote Diagrams: Organize Ideas Brilliantly
    ID: #KD00129
    $25.00
  • like 4
    (324)
    Venn Superimposed Sheets Keynote Diagrams: Reveal Hidden Connections
    ID: #KD00128
    $25.00
  • like 2
    (1165)
    Editable Internal & External Destinations Keynote Diagrams
    ID: #KD00127
    $24.00
  • like 5
    (214)
    Communication Diagrams Template for Keynote Presentations
    ID: #KD00122
    $18.00
  • like 4
    (383)
    Observe, Think, Do: Keynote Diagrams Template for Presentations
    ID: #KD00116
    $16.00
  • like 3
    (164)
    Oil and Gas Production Presentations with Keynote Diagrams Template
    ID: #KD00097
    $15.00
  • like 3
    (136)
    Map Events: Global Architecture Timeline Keynote
    ID: #KD00095
    $18.00
  • like 2
    (89)
    Column Graph Keynote Diagrams: Visualize Market Dynamics with Ease
    ID: #KD00089
    $10.99
  • like 4
    (313)
    Dollar Money Banking Keynote Diagrams: Visualize Financial Flows with Elegance
    ID: #KD00088
    $16.00
  • like 2
    (301)
    Activity Based Costing Keynote diagrams
    ID: #KD00067
    $12.00
  • like 4
    (11)
    Collection Keynote Diagrams Template: Dimensions of Design Excellence
    ID: #KD00056
    $27.99


Diagramming Information for Maximum Clarity

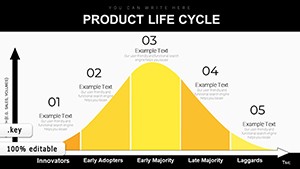
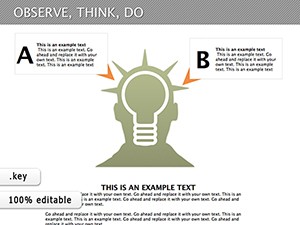
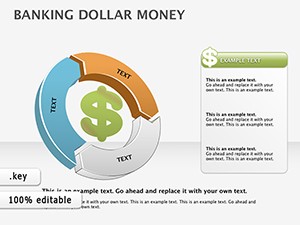
Information overload plagues modern discourse - our Keynote diagrams counteract by prioritizing flow, like cycle diagrams looping feedback mechanisms. This cyclical view reveals interconnections often missed in linear text.

Surpassing vanilla Keynote shapes, these templates pack pre-linked connectors and legend builders, automating upkeep. Essential for intel-heavy fields, they foster trust through transparent structures.

Practical Scenarios for Information Handling

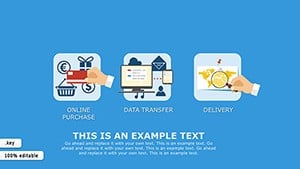
  • Business Intelligence: Database schemas diagramming query paths for team alignments.
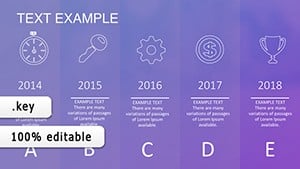
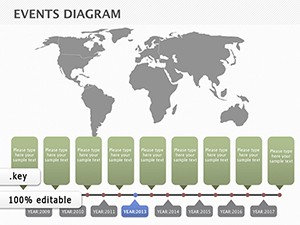
  • Journalism: Timeline diagrams chronicling events with sourced annotations.
  • Tech Briefs: UML diagrams outlining software architectures.
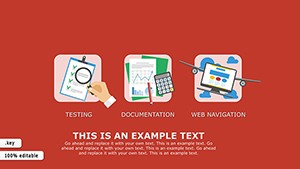
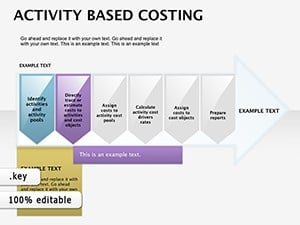
  • Health Reports: Flowcharts mapping patient journeys.

These contexts highlight diagrams` role in demystifying data.

Superiority Over Basic Diagram Tools

Keynote basics require manual alignments prone to errors; ours auto-snap elements and validate connections, ensuring integrity. Visual appeal amps up too, with gradient fills denoting info intensity.

Efficiency gains: Assemble complex diagrams 50% quicker, channeling energy into insights over infrastructure.

Fine-Tuning Diagram Effectiveness

  1. Employ consistent arrow weights for hierarchy signaling.
  2. Group related info clusters with bounding boxes.
  3. Integrate pop-up notes for supplementary facts.
  4. Color-code by info type: Reds for alerts, blues for baselines.

These refinements sharpen communicative edge.

Exploring Diagram Innovations

Venture into 3D extrusions for volumetric info or interactive hotspots toggling layers. For global teams, multilingual labels enhance accessibility. Such evolutions keep diagrams fresh and functional.

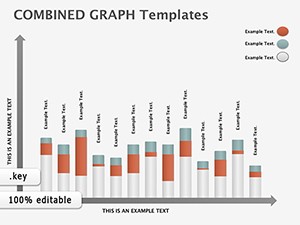
Fuse with charts for hybrid views, like overlaid Venns on bars, enriching narratives.

Clarify confidently? Delve into our information diagrams and depict distinctly.

Frequently Asked Questions

Compatibility with iPad Keynote?

Seamless, with touch-optimized controls for on-the-go edits.

Handling multilingual text?

Supports Unicode for global info flows.

Diagram complexity limits?

Up to 500 nodes, with optimization tips for larger sets.

Animation syncing?

Timeline-based reveals for phased info disclosure.

Export to vector formats?

SVG and EPS for scalable sharing.