Empower your project execution with our expert-curated implementation PowerPoint diagrams. Tailored for project managers, consultants, and team leads, these diagrams offer a structured way to map out rollout phases, resource allocation, and progress tracking, ensuring every initiative launches smoothly.
Featuring versatile shapes like Gantt timelines, process flows, and dependency matrices, our designs eliminate guesswork and foster alignment. High-contrast visuals and modular components make them adaptable to any scale, from software deployments to organizational changes.
Experience the difference of diagrams that not only illustrate but also anticipate challenges. Download today and turn plans into actionable roadmaps with professional flair.

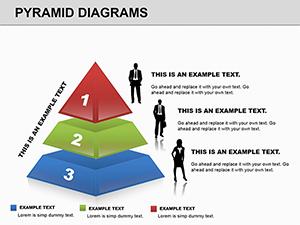
Our implementation PowerPoint diagrams are indispensable for bridging strategy and action. In software rollouts, swimlane diagrams delineate roles across IT and user teams, clarifying handoffs. For business transformations, pyramid diagrams layer objectives from vision to tactics, providing a clear ascent to goals.
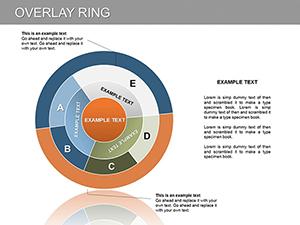
Project kickoffs benefit from roadmap visuals that timeline deliverables, while risk assessments use Venn diagrams to overlap threats and mitigations. These tools shine in agile environments, adapting to sprints with flexible node connections.
Consultants leverage these for client workshops, using mind maps to brainstorm implementation barriers. In advisory reports, Sankey diagrams flow resources through stages, quantifying efficiencies.
PowerPoint`s built-in diagrams often constrain creativity with limited styles, but ours expand horizons with thematic variants - tech gears for IT implementations or gears for mechanical processes. Enhanced with shadow effects and gradient fills, they convey depth and professionalism unattainable in basics.
Integration with Excel for live data updates keeps diagrams dynamic, unlike static defaults that require manual redraws.
Align diagrams with project methodologies - Waterfall suits linear flows, while Agile favors iterative loops. Use consistent notation: arrows for sequences, diamonds for decisions. Validate with stakeholders early to refine connections.
Enhance with color-coded legends for quick scans, and incorporate metrics like KPIs within nodes for at-a-glance insights.
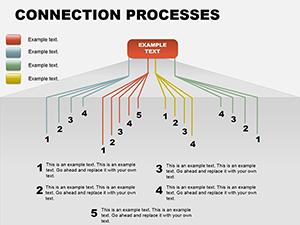
A tech firm implements ERP via a multi-stage cascade diagram, each tier detailing config and testing. A nonprofit rolls out community programs with a radial diagram, spokes representing outreach arms. These cases show diagrams as catalysts for cohesive execution.
For global expansions, geopolitical maps overlay implementation zones, highlighting regulatory variances.
Select your ideal diagram from our library and propel your projects forward. Instant downloads mean immediate impact.
Copyright © 2009-2026 ImagineLayout All rights reserved.