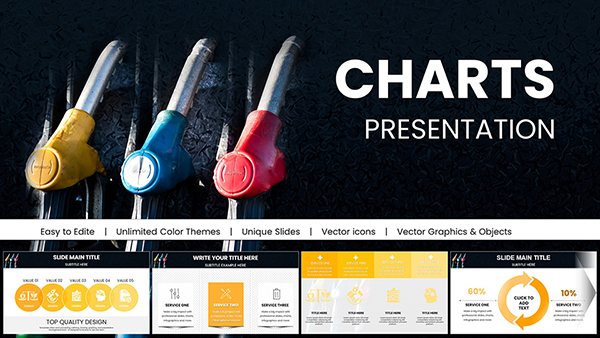
Transform raw numbers into compelling narratives using our Ideal Keynote chart templates, crafted for presenters who need to convey insights with precision and flair. Aimed at analysts, marketers, and executives, these designs simplify data storytelling, helping you captivate audiences without overwhelming them.
Featuring a range of chart types - from sleek pie visuals to interactive timelines - each template integrates seamlessly into Keynote, with animations that reveal points progressively. Ideal for quarterly reviews, pitch meetings, or educational sessions, they ensure your data drives decisions.
Browse the selection to find charts that match your theme, and customize effortlessly to reflect your brand. Instant access means you`re ready to impress at your next presentation.
These templates go beyond basic graphs by offering layered animations and responsive elements that adjust to your dataset, outshining Keynote`s defaults with professional polish.
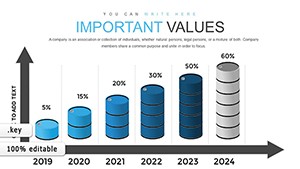
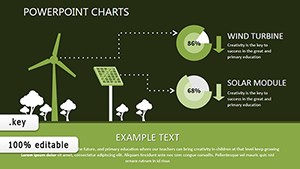
For sales teams, bar charts with trend lines highlight growth trajectories. Data scientists can employ scatter plots for correlation analysis. Teachers might use flowcharts to map processes visually.
Standard charts often lack customization depth, but Ideal versions include editable icons and color gradients for tailored appeal.
Choose chart types based on data nature - lines for trends, areas for comparisons. Apply consistent scales and labels for accuracy. Animate entrances to build suspense, pacing with your narrative.
Recommendation: Limit to 5-7 data points per slide for focus, and use tooltips for details on hover.
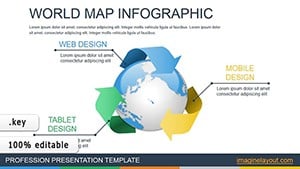
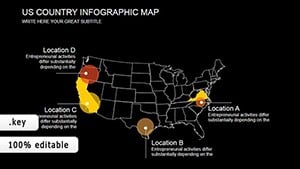
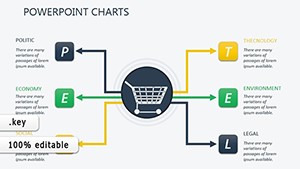
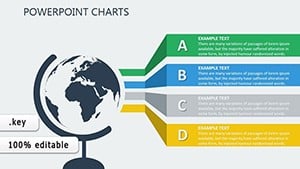
Consider a market analysis deck: Layer radar charts to compare competitors at a glance. For sustainability reports, stacked bars show progress over time. These applications demonstrate versatility in real scenarios.
Embed live data links for updates, keeping slides current. Users note 30% higher engagement from visually rich charts.
Select and download Ideal Keynote charts today to supercharge your slides. Quick-start videos guide your edits.
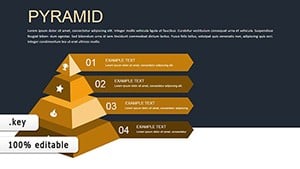
From bars and pies to advanced Gantt and Sankey diagrams.
Yes, smooth transitions and builds for dynamic reveals.
Copy-paste from Excel or use Keynote`s data editor.
Export as PDF, images, or PowerPoint-compatible files.
Designs scale perfectly for various screen sizes.
Combine with full presentation sets for cohesive decks. Get started with downloads now!
Copyright © 2009-2026 ImagineLayout All rights reserved.