Diagrams are the silent heroes of effective communication, turning abstract concepts into clear, memorable visuals. Our PowerPoint diagram templates are meticulously designed to help professionals, educators, and analysts convey complex information with precision and style.
From corporate strategists mapping out project timelines to teachers illustrating scientific processes, these templates provide a versatile toolkit. Each one features intuitive layouts that support data-driven narratives, ensuring your audience grasps ideas faster and retains them longer.
Built with scalability in mind, our diagrams adapt seamlessly to any slide size or theme. Swap nodes, arrows, and colors effortlessly to align with your content`s tone - whether it`s a high-stakes board meeting or an interactive workshop.
Elevate your slides today: Peruse this selection of diagram templates and integrate them into your next presentation for standout results.
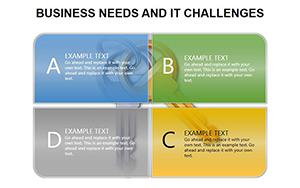


PowerPoint diagram templates shine in scenarios demanding clarity amid complexity. In business, they excel at depicting organizational hierarchies or supply chain flows, helping teams align on goals. Educators use them to break down historical events into sequential timelines, fostering deeper understanding.
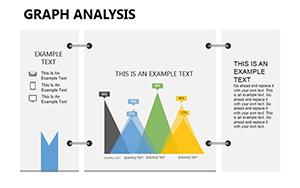
Project managers rely on Gantt-style diagrams to track milestones, while marketers visualize customer journeys through funnel diagrams. These tools bridge gaps in communication, making intricate details accessible to diverse audiences.
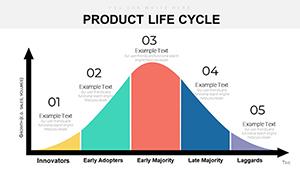
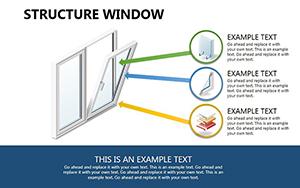
For learning environments, cycle diagrams illustrate biological processes like the water cycle, with labeled segments that encourage interactive discussions.
Standard PowerPoint shapes often lead to inconsistent, time-consuming builds that lack cohesion. Our templates, however, arrive fully assembled with smart connectors that auto-adjust as you edit, maintaining aesthetic integrity.
Where defaults might produce rigid lines, ours incorporate curved paths and gradient fills for a modern touch, enhancing perceived professionalism. Users appreciate the embedded animations that reveal elements sequentially, guiding viewer focus without distraction.
Comparatively, building from scratch can take hours; our pre-made options cut that to minutes, with built-in accessibility features like alt text prompts for screen readers.
Begin with simplicity: Limit nodes to 7-9 per diagram to avoid overload, using hierarchy to prioritize key elements. Color-code categories logically - blues for processes, greens for outcomes - to leverage intuitive associations.
For engagement, add subtle hover effects in digital versions or printable legends for handouts. Test diagrams in grayscale to ensure they remain effective without color reliance.
Advanced application: Layer multiple diagrams in a master slide for comparative analysis, such as before-and-after process maps in consulting reports.
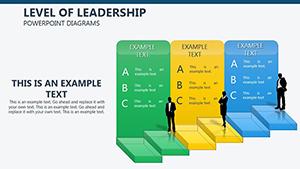
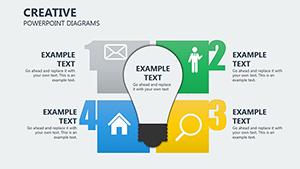
A tech startup might use a mind map template to brainstorm features, branching from core ideas to user benefits. In healthcare, pyramid diagrams outline treatment protocols, with base layers for diagnostics and apex for recovery metrics.
These examples highlight how diagrams transform static slides into interactive tools that drive decisions and discussions.
Visualize your vision now - select from our PowerPoint diagram templates and download for immediate use.
We offer flowcharts, org charts, timelines, Venn diagrams, and more, all optimized for PowerPoint.
Yes, compatible with PowerPoint 2013 and above, with full functionality in newer releases.
Templates export easily to Google Slides or Keynote with minimal adjustments.
Built-in animation paths are preset; customize via the Animations tab for tailored sequences.
Absolutely, integrate Excel data for auto-updating charts and graphs within diagrams.
Bring clarity to your content - download a PowerPoint diagram template today and simplify your storytelling.
Copyright © 2009-2026 ImagineLayout All rights reserved.