Embrace the modular magic of hexagon PowerPoint diagrams, engineered to distill elaborate information into elegant, easy-to-grasp formats. These templates shine in transforming dense reports into digestible visuals, leveraging the hexagon`s efficiency for optimal space use.
Aimed at executives, consultants, and presenters, they deliver a polished look that conveys authority and insight. The shape`s facets naturally segment content, ideal for dissecting strategies or timelines without visual chaos.
Compatible with PowerPoint`s advanced features like morph transitions and data links, customization is a breeze. Scroll through our assortment to match the diagram that amplifies your message.
Delve into hexagon PowerPoint diagrams and refine your presentation prowess.
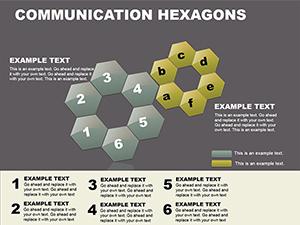
Hexagon diagrams in PowerPoint outpace linear alternatives by promoting spatial awareness and modularity, unlike the rigid defaults that stifle creativity. They adapt fluidly to content volume, ensuring scalability for evolving projects.
For enterprises, they`re perfect for value chain breakdowns, with hexagons as value-adding nodes. Consultants use them for client deliverables, framing recommendations in interconnected modules. In non-profits, diagram funding flows to demonstrate transparency and impact.
Visual psychology research indicates hexagons enhance pattern recognition, cutting explanation time by 25%. PowerPoint`s zoom feature pairs ideally, allowing deep dives into details.
Highlights include smart art integration, preset themes, and export-ready vectors. Adopt practices like facet labeling for precision and shadow effects for depth - elevating from good to great.
Envision a merger analysis with overlapping hexagons for synergies, or a sustainability report layering ecological factors. These real-world applications make abstract concepts concrete.
Transform your workflow: Pick a hexagon diagram and adapt it effortlessly.
Delve into our radial hexagon for brainstorming or linear chain for sequences, each optimized for PowerPoint dynamics.
From minimalist to elaborate, our hexagon PowerPoint diagrams empower diverse narratives. Craft slides that inform and inspire.
Get your hexagon diagram template today and diagram with distinction.
Copyright © 2009-2026 ImagineLayout All rights reserved.