Architect your expansions through our growth PowerPoint diagram templates, geared toward coordinators, developers, and visionaries. These interconnected frameworks illustrate workflows, from initial concepts to scaled implementations, fostering alignment and foresight.
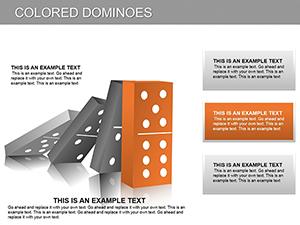
Including process maps, dependency webs, and phased cycles, each diagram employs robust links and illustrative symbols. Tailored for team huddles on scaling operations or innovation brainstorms, they clarify routes amid complexity.
Engineered for teamwork, supporting co-editing and comment threads. Sculpt sharper strategies with these diagrams. Survey the series and diagram deliberately.
Primed to progress? Obtain a growth PowerPoint diagram template and construct clarity.
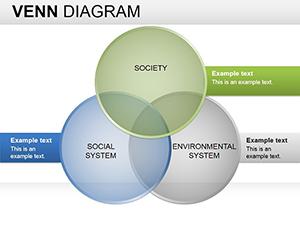

These diagrams anchor growth narratives. Operations leads chart supply chain evolutions with linear processes, while product owners map feature rollouts in swimlane formats. Strategy sessions employ mind maps for idea proliferation.
Trainers diagram skill-building paths, and sales forecast customer journey funnels. Spanning logistics to ideation, they underpin practical and aspirational growth alike.
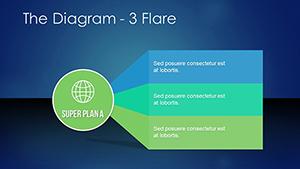
Stock diagrams rigidify; ours pulse with growth dynamics like expanding rings or vein patterns, featuring drag connectors that intuit paths, surpassing vanilla tools in adaptability and appeal.
Excels in: Layered visibility toggles and metric integrations per junction. Sage advice: Cluster related nodes, employ dashed lines for projections; sequence reveals for narrative pull. Hyperlink clusters to sub-diagrams.
Venture into hybrids blending diagrams with photos or videos. Instance: A scaling ecosystem web linking departments with throughput indicators.
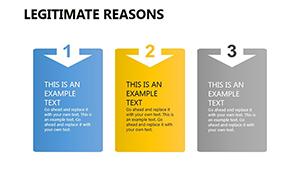
For expansion planning, a cascade diagram tiers organizational layers. In training, flowchart decisions for troubleshooting. Iterate through prototypes, streamlining based on usability tests.
Champion universal design with intuitive symbols and audio cues. Evolve with template variants for seasonal emphases.
Assortment includes compact to expansive layouts for scope matching. Fortify with symbol vaults for personalization.
Download a growth PowerPoint diagram template at once and weave your web of wins.
Copyright © 2009-2026 ImagineLayout All rights reserved.