Diagrams transform abstract concepts into visual roadmaps, essential for guiding audiences through processes in PowerPoint decks. ImagineLayout`s diagram templates cater to project managers, strategists, and trainers aiming to illustrate workflows, hierarchies, or relationships effectively.
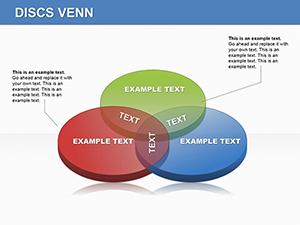
Featuring flowcharts, Venn diagrams, timelines, and cycle models, our designs use intuitive connectors and icons for instant comprehension. Perfect for strategy sessions, training modules, or product demos, they blend seamlessly into any presentation theme.
Highlights include drag-and-drop editing, theme synchronization, and export options for handouts. Convey ideas faster and foster better discussions with visuals that resonate.
Visualize your vision - explore PowerPoint diagram templates and streamline your storytelling.

Basic shapes in PowerPoint often result in cluttered slides; our pre-built templates provide polished, proportional layouts that enhance professionalism and save revision time - up to 60% faster assembly reported by users.
Best practices: Use arrows sparingly for direction, group related elements with containers, and animate paths sequentially for guided reveals.
Incorporate hyperlinks between nodes for drill-downs, or layer transparency for overlapping insights. Versus stock diagrams, ours include thematic icons libraries, enriching narratives without extra sourcing.
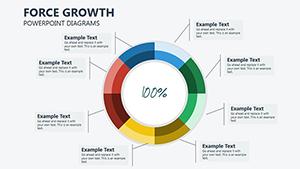
Example: A marketing funnel diagram with conversion metrics, color-coded stages fading to show drop-offs.
Prioritize logical flow - left-to-right for Western audiences, circular for cycles. Maintain node uniformity for balance, and embed legends for symbol decoding.
Templates support master slide integration, applying changes deck-wide effortlessly.
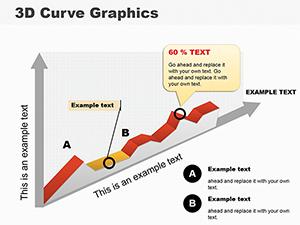
Flowcharts suit sequential processes; radial maps excel for brainstorming hubs. Hybrid versions combine both for multifaceted topics.
Clarify your concepts - download a PowerPoint diagram template and map out success!
Adapt for virtual meetings with clickable hotspots, or print as posters for workshop walls. Seasonal variants, like holiday timelines, add timely relevance.
In education, mind maps branch ideas for collaborative learning; in sales, pyramid diagrams layer value propositions upward.
Illustrate ideas brilliantly - select your PowerPoint diagram template today.
Copyright © 2009-2026 ImagineLayout All rights reserved.