PowerPoint diagrams are essential for visualizing workflows, hierarchies, and relationships in presentations. Our specialized templates transform abstract concepts into clear, engaging visuals, perfect for business strategists, educators, and project managers seeking to communicate effectively.
From flowchart designs that map decision paths to cycle diagrams illustrating continuous processes, each template is built with vector graphics for scalability and ease of editing. Customize shapes, colors, and animations to match your brand, ensuring your slides resonate with viewers.
Ideal for board meetings, training sessions, or academic lectures, these diagrams save hours of manual drawing while delivering polished results. Dive into our collection and discover how a single template can redefine your storytelling in slides.
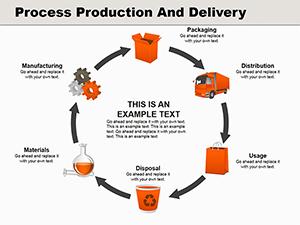

Diagrams in PowerPoint serve multifaceted roles across industries. In corporate environments, use process flow templates to outline operational efficiencies, helping teams identify bottlenecks. Marketing professionals employ Venn diagrams to compare product features, making pitches more persuasive.
Educational settings benefit from mind map layouts that aid in brainstorming sessions, fostering student creativity. Healthcare presenters utilize organogram templates to depict team structures in training modules. Even non-profits find value in timeline diagrams for project milestones, keeping donors informed.
Such versatility ensures diagrams enhance any narrative, turning data into digestible stories.
Standard PowerPoint shapes often result in cluttered, amateurish slides due to limited preset options. Our templates, however, offer pre-arranged, aesthetically balanced compositions that maintain alignment and flow. Defaults require extensive resizing and connecting, prone to errors, while ours feature smart connectors that adjust automatically.
Advanced animations and transitions are embedded, adding dynamism without extra effort. Color gradients and icons provide a modern edge, far surpassing the flat defaults.
| Aspect | Basic Diagrams | Our Templates |
|---|---|---|
| Layout Precision | Manual alignment | Auto-snap features |
| Animation Options | Limited presets | Custom sequences |
| Aesthetic Quality | Generic shapes | Themed illustrations |
This edge translates to more impactful presentations.
Our templates boast infinite scalability, retaining clarity at any zoom level. Layered structures allow selective edits, and compatibility extends to Google Slides for collaborative work. Eco-friendly vector formats reduce file sizes, speeding up load times.
Inclusivity is prioritized with color-blind friendly palettes and screen-reader optimized labels. Regular updates incorporate user-suggested enhancements, like interactive hotspots for digital decks.
Begin by sketching your core message on paper to select the fitting diagram type. Limit elements to five per slide for clarity, and use contrasting colors for emphasis. Animate reveals sequentially to guide viewer focus.
For example, a sales funnel diagram customized with brand hues can vividly depict conversion rates, captivating stakeholders.
Peruse our diagrams and secure downloads to amplify your next presentation. Professionalism awaits.
Addressing these ensures a seamless experience.
Copyright © 2009-2026 ImagineLayout All rights reserved.