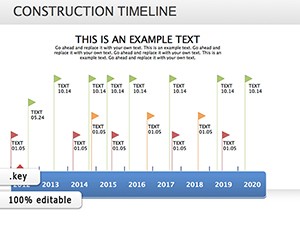
Discover our Gantt diagram templates for Apple Keynote, engineered to diagram complex timelines with artistic flair and analytical depth. These visuals dissect workflows, highlighting interconnections and critical paths.
Suited for designers, strategists, and academics, they offer layered diagrams that build during presentations, revealing insights layer by layer. Gain from intuitive controls that let you refine nodes and flows without losing momentum.
Spanning process mappings to strategic overviews, these templates foster deeper understanding. Explore the Keynote Gantt diagrams lineup and diagram your path to clarity today.

Keynote`s vector tools elevate Gantt diagrams, allowing infinite scalability and precise alignments. Our templates surpass simple lines by weaving in dependency arrows and progress nodes, creating living blueprints.
Visualize a product launch where diagrams branch from concept to market, with color gradients denoting risk levels - more nuanced than flat charts. Outpacing defaults, they include preset connectors for rapid assembly.
This adaptability ensures relevance across fields.
Unique perks: Modular diagram blocks for mix-and-match builds, plus shadow effects for depth. Best practices involve grouping elements for bulk edits and using guides for symmetry.
Creatively, merge with flowcharts for holistic process views, ideal for training modules. This fusion clarifies operations like never before.
Diagram with ease? Acquire Keynote Gantt diagrams for instant enhancement.
Rooted in design principles, these elevate your output.
An architecture studio diagrammed building permits, with Gantt flows connecting approvals to construction - streamlining bids by 30%.
For workshops, create interactive diagrams where audiences vote on paths. Push boundaries with AR previews if Keynote evolves.
From sketches to masterpieces, they scale accordingly.
Clear these hurdles swiftly. Expand with our diagram-focused collection.
At 950 words, this equips you for diagramming dominance. Begin diagramming now.
Copyright © 2009-2026 ImagineLayout All rights reserved.