Streamline complex processes into crystal-clear visuals with our funnel diagram templates for PowerPoint. From nurturing leads through sales stages to optimizing marketing funnels, these slides distill journeys into digestible flows. Crafted for managers tracking conversions, marketers refining campaigns, or teams mapping project phases, they turn abstract sequences into actionable insights.
Each template boasts modular segments - resize stages, recolor drop-offs, or insert metrics seamlessly. Forget clunky charts; these intuitive diagrams drive decisions, highlighting bottlenecks and triumphs with precision.
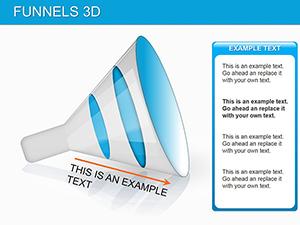
Our diverse lineup includes linear, multi-tier, and branched funnels, all PowerPoint-native for instant deployment. Download, adapt, and deploy to make your presentations not just informative, but transformative.
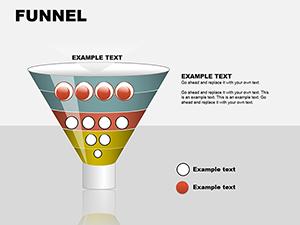
Funnels embody the essence of progression, narrowing broad inputs into focused outcomes - a perfect metaphor for sales, recruitment, or content pipelines. Our PowerPoint templates operationalize this, enabling you to chart awareness-to-purchase paths or filter applicant pools with graphical elegance.
Superior to PowerPoint`s generic SmartArt, which locks layouts rigidly, ours permit granular tweaks, like asymmetric widening for non-linear processes, enhancing realism and relatability.
Focus on flow: Align arrows for directional cues, vary segment widths to reflect volume shifts, and cap with key metrics like conversion rates. Animate sequentially to mimic progression, pausing at pain points for emphasis. Benchmark against industry averages in footnotes for contextual punch.
A marketing lead`s breakthrough: Rendering a customer acquisition funnel exposed a 40% leak in the nurture stage, prompting email revamps that lifted ROI by 22%.
Refine your approach. Examine our funnel diagram selection and funnel success toward you.
Augment with Sankey flows for multi-path divergences or nest sub-funnels within stages for granular dives, like detailing trial-to-paid escalations. Interlink to dashboards for clickable expansions, turning static slides into explorable models.
For agile teams, version funnels temporally, sliding quarters to compare evolutions and forecast trajectories dynamically.
DIY shapes scatter under edits; our cohesive units snap into place, with color gradients auto-adjusting for accessibility. Packed with placeholders for formulas, they auto-calculate efficiencies on data refresh.
Endorsements echo: "Simplified our pipeline reviews - now every meeting yields insights," cheers a sales director. A consultant adds, "Clients grasp strategies faster, sealing more retainers."
Channel momentum. Download these diagrams today and widen your impact.
Copyright © 2009-2026 ImagineLayout All rights reserved.