Navigate problem-solving with finesse using our fishbone diagram templates tailored for PowerPoint, where every "bone" uncovers layers of contributing factors in an intuitive fish-like structure.
Perfect for quality managers, project leads, and investigators, these templates facilitate thorough examinations, turning vague issues into actionable intel. Harness PowerPoint`s grouping and alignment tools for effortless refinements, complete with categorized spines and head-focused effects.
Our designs prioritize usability, featuring drag-ready labels and scalable spines that fit any slide size. Move from frustration to resolution faster with visuals that invite collaboration and clarity.
Discover fishbone templates and hook the real story behind your challenges.
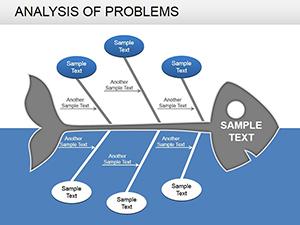
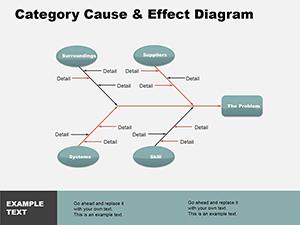
Fishbone diagrams, aka Ishikawa, mimic a skeleton to categorize causes - spines for factors like methods or materials, head for the problem. PowerPoint amplifies this with layered objects and entrance effects, simulating bone assembly for dramatic reveals.
Templates come pre-segmented into classic 6M categories, with editable text paths for curved labels.
Outpacing default drawings, ours use locked ratios to prevent spine distortions and include variant angles for aesthetic variety. This precision aids in focusing discussions on content over cosmetics.
Nurses diagram patient delays to staffing and protocol spines, optimizing workflows and enhancing care delivery through targeted interventions.
Devs trace bugs to code, environment, and user spines, accelerating fixes and elevating product reliability in agile sprints.
Coordinators link mishaps to vendor, logistics categories, refining future events for flawless execution.
Basic PowerPoint fishbones require manual spine draws, prone to asymmetry; ours auto-balance and offer color floods for emphasis. Plus, integrated legends explain categories at a glance.
Users report 50% faster assembly, freeing time for deeper analysis.
Orient horizontally for wide screens, vertically for prints. Weight spines by cause severity with line thickness. Animate from head backward to emphasize effects first.
Embed photos on bones for evidence, using picture placeholders. Share via OneDrive for co-editing.
Dive into solutions - secure your fishbone template immediately.
For marketing, skeleton campaign failures to channel bones. In education, teach history via event fishbones, linking wars to socio-economic spines.
Enhance with 3D rotations for immersive views in modern decks.
Reel in root causes with ease. Download your template and start dissecting.
Copyright © 2009-2026 ImagineLayout All rights reserved.