Streamline root cause analysis with our specialized collection of fishbone diagram templates for Keynote. Also known as Ishikawa or cause-and-effect diagrams, these layouts help teams identify, organize, and present underlying issues clearly and professionally.
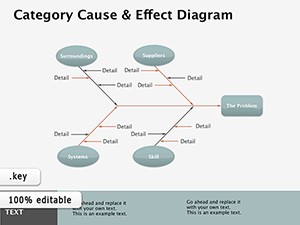
Over 70 meticulously designed templates offer variations for 4M, 6M, and 8M categories (Man, Machine, Method, Material, etc.), plus customizable blank versions. Each is fully editable with clean lines, modern colors, and optional animations.
Perfect for quality managers, project leaders, educators, and consultants who need to facilitate productive discussions and drive actionable solutions.
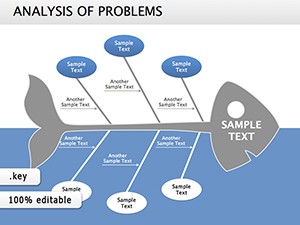
Unlike basic shapes in Keynote, our fishbone templates provide structured category branches, balanced layouts, and visual hierarchy that guide viewers directly to key insights. They save significant setup time while ensuring professional appearance.
Analyze production defects, customer complaints, or service delays to uncover hidden causes.
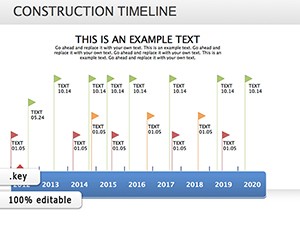
Conduct thorough reviews of missed deadlines or budget overruns with structured cause mapping.
Facilitate collaborative workshops where every team member can contribute ideas visually.
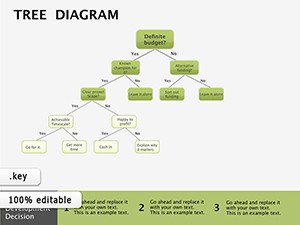
Teach problem-solving methodologies in business, engineering, or healthcare courses.
Ready to solve problems faster and smarter? Browse our fishbone diagram collection and download now.
Choose from classic horizontal layouts, vertical designs, colorful modern styles, minimalist black-and-white versions, and templates with pre-labeled categories for manufacturing, service, marketing, or healthcare contexts.
Find the perfect fishbone diagram for your next analysis - explore the full library today.
Templates range from 4 to 8 main branches, with fully customizable options to add or remove as needed.
Yes - every branch supports multiple levels of sub-causes with easy duplication and alignment.
Absolutely - clean layouts and editable text make real-time collaboration smooth and effective.
Many templates feature optional entrance animations for branches and labels.
Yes - all maintain clarity when exported to PDF or printed in any size.
Copyright © 2009-2026 ImagineLayout All rights reserved.