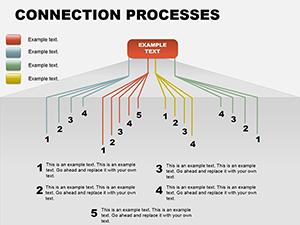
Diagrams distill financial intricacies into navigable maps, essential for strategy sessions. Our financial PowerPoint diagram templates offer versatile shapes for org charts, process flows, and value chains, empowering clear communication in dynamic markets.
For strategists, auditors, and teams, they facilitate breakdowns like supply chain costs or decision trees for investments. Drag-and-drop ready, they adapt to your narrative without losing polish.
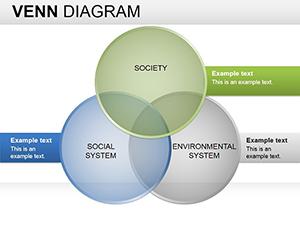
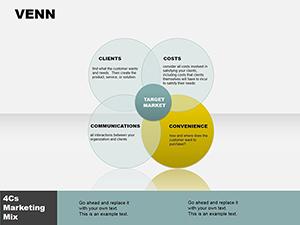
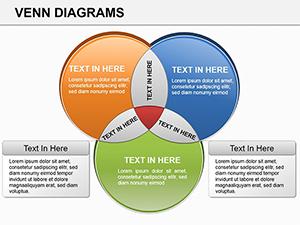
Select flowchart styles for compliance workflows or Venns for partnership overlaps. Harness PowerPoint`s connectors for fluid updates.
Examine our diagrams range and diagram your way to sharper financial discourse.


Deploy in planning where swimlane diagrams delineate departmental budgets, or risk assessments using fault trees for threat modeling. Consultants diagram client journeys from intake to portfolio review.
Default shapes misalign for finance; ours feature currency nodes and percentage branches, aligning with IFRS visuals.
Standards require connector fiddling; ours auto-snap with theme syncing, plus animation paths for phased reveals, cutting build time 45%.
Values: Hierarchical scalability and exportable SVGs for reports.
Layer Sankey for resource allocations or mind maps for brainstormed acquisitions. Animate cycles for recurring revenues.
Practices: Limit nodes to 7, color-code risks, embed hyperlinks. Showcase "Strategic Finance Flow" for end-to-end ops.
Clarify visions - access diagram templates immediately.
Apply to blockchain transaction flows or ESG matrices. Commodities traders diagram supply disruptions.
Excel over primitives with smart guides. Tip: Group elements for reusable modules.
Derivatives desks map payoff structures. Empower your slides with diagrams.
From cap tables to capex cycles, versatility abounds. Structured visuals propel informed finances.
Copyright © 2009-2026 ImagineLayout All rights reserved.