Deliver authoritative financial overviews with our PowerPoint templates for reports. Structured for balance sheets, income statements, and trend analyses, they make complex finances accessible and compelling.
Suited for analysts, managers, and auditors, these decks prioritize data visualization with pivot tables and dashboards. Effortlessly highlight variances, forecasts, and recommendations to guide strategic talks.
Responsive designs ensure crisp projections on any screen, with layered info for drill-downs. Customize headers and palettes to reflect your organization`s identity seamlessly.
Scan the assortment and download a template to fortify your fiscal storytelling.
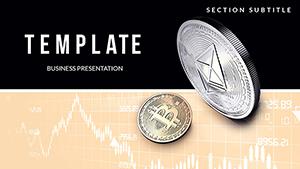
Difference Bitcoin and Ethereum PowerPoint templates
ID: #PP02516
$12.00
(574)
Bitcoin Vs Ethereum PowerPoint templates
ID: #PP02515
$12.00
(352)
Bitcoin, Ethereum, and Litecoin Price PowerPoint templates
ID: #PP02514
$12.00
Mastering Financial Narratives in PowerPoint
Financial reports bridge numbers and strategy; our templates streamline this with intuitive hierarchies. Hyperlinked indexes navigate sections fluidly, from assets to liabilities.
CFOs present annuals to shareholders; auditors detail compliance checks. Consultants unpack client portfolios with tailored metrics. Collaboration thrives via co-authoring features.
Broad Use Cases for Reporting Excellence
Annual Reviews: Synthesize year-over-year shifts with comparative bars.
Budget Allocations: Allocate via pie visuals for departmental buy-in.
Risk Assessments: Map exposures with heat maps for proactive measures.
Eclipsing plain exports, ours embed formulas for dynamic recalcs. Guideline: Anchor with summaries, substantiate with details, close with implications.
Adapting for Precision and Polish
Infuse brand elements, automate via Excel links, or add tooltips for interactivity. Depict a merger`s impact through waterfall charts - illuminating synergies crisply.
For global ops, multi-currency toggles simplify. Innovators in banking adapt for regulatory filings, streamlining audits. Testimonials note 65% faster prep.
Optimization Techniques for Impact
Prioritize key metrics on opening slides.
Use consistent scales across visuals.
Incorporate footnotes for transparency.
Rehearse with timings for paced delivery.
Empower your reports - select and start.
Sector-Driven Innovations and Examples
Healthcare tracks reimbursement trends; real estate values portfolios via maps. Signature: Scenario sliders for sensitivity tests. Versus norms, enhanced accessibility with screen-reader tags.