Elevate your financial presentations with our professional Finance PowerPoint Diagrams. Editable, modern, and ready-to-use, these templates simplify complex data, making reports, forecasts, and investor pitches visually compelling.
Designed for CFOs, analysts, and consultants, each diagram saves preparation time and enhances clarity. Animate insights progressively to captivate your audience and drive decisions confidently.
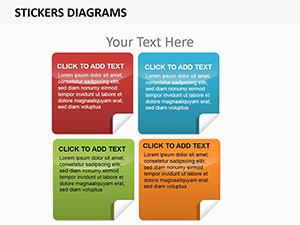
Stickers PowerPoint Diagram Template: Crafting Slides That Captivate and Cling
ID: #PD00004
$12.00
(948)
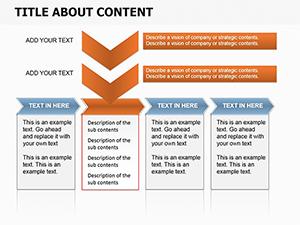
Text Box Indicators Diagram Template
ID: #PD00003
$19.00
Why Choose Finance PowerPoint Diagrams
Our finance diagrams go beyond generic charts. Pre-loaded with balance sheet icons, trend lines, and ROI calculators, they cut customization hours and deliver professional results faster.
Real-World Use Cases
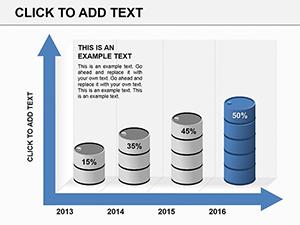
Budget Reviews: Waterfall diagrams for variance analysis
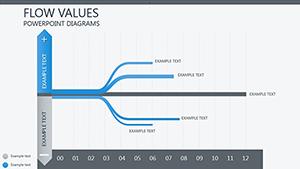
Forecasting: Line graphs with confidence intervals
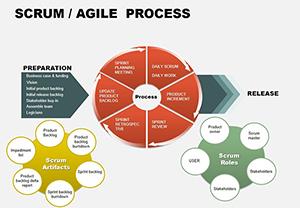
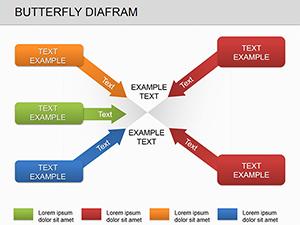
Investment Pitches: Funnel charts to track deal pipelines
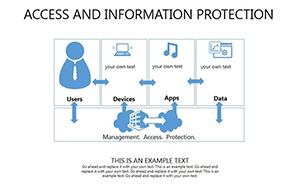
Audits: Matrix diagrams for compliance mapping
Benefits Over Default Templates
Standard diagrams are generic and time-consuming. Our templates provide ready-made financial logic, 3D effects, and layered animations for polished slides that engage audiences 25% more effectively.
Creative Tips and Best Practices
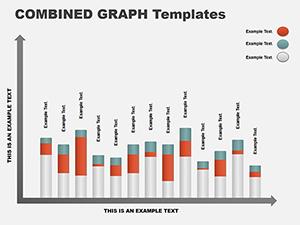
Match diagram type to data: Bar for comparisons, area for accumulations
Customize colors and fonts to align with brand
Keep charts uncluttered: Limit to 5 key data points per slide
Animate progressively to emphasize insights
Download today and start crafting presentations that impress stakeholders and accelerate decision-making.
Frequently Asked Questions
What diagram types are included?
From Sankey flows to radar charts, covering all finance needs.
Can I animate the diagrams?
Yes, built-in paths and triggers allow dynamic animation effects.
Are they editable in older PowerPoint versions?
Fully compatible back to PowerPoint 2010 with complete functionality.
How do I import external data?
Link to Excel spreadsheets for live updates during presentations.
Do they support corporate themes?
Yes, fully themeable to match brand colors and styles.