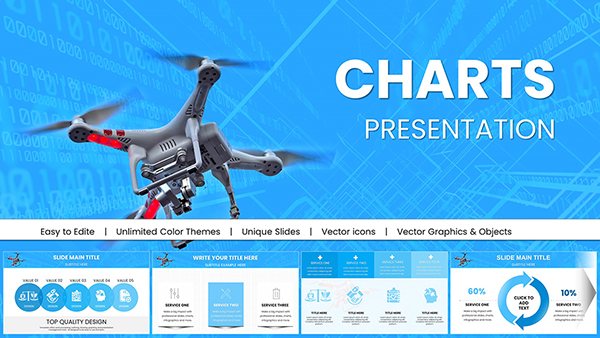
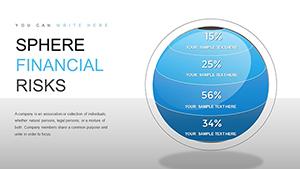
Master the art of financial visualization with our PowerPoint chart templates, honed for accuracy in high-pressure settings. Suited for actuaries, risk managers, and sales directors in finance, these charts distill vast datasets into digestible, persuasive elements.
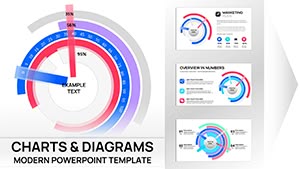
Delve into options like histogram for distribution analysis, combo charts merging lines and bars for multifaceted insights, or treemaps for hierarchical breakdowns - all primed for PowerPoint`s robust toolkit. Edit with ease: recalibrate scales, overlay trends, and apply filters for scenario modeling.
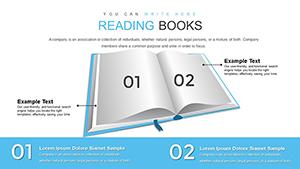
Core benefits: heightened comprehension leading to better decisions, compatibility with Excel linkages for live updates, and versatile styling from corporate neutrals to vibrant accents. For teams preparing earnings calls or funding rounds, these templates deliver reliability without the redesign hassle.
Peruse our offerings and chart a course to more compelling narratives.

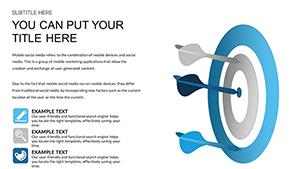


Deploy these in board analyses where funnel charts trace lead conversions in wealth acquisition pipelines. Traders harness polar charts for asset allocation radars, pinpointing diversification gaps swiftly.
In policy advising, step charts delineate phased implementations of fiscal reforms, aiding legislative buy-in. Creative consultants for crypto firms visualize blockchain metrics via network diagrams, merging tech with traditional finance aesthetics.
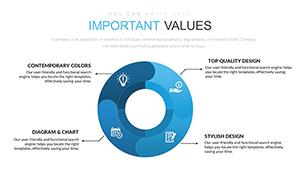
Built-in charts in PowerPoint handle basics but falter on finance nuances like dual-axis syncing for currency fluctuations. Ours provide advanced formulas, error bar presets for statistical rigor, and conditional formatting for threshold alerts - elevating beyond vanilla to virtuoso levels.
Unique propositions: modular add-ons for Monte Carlo simulations and batch export for multi-format decks. Best approaches: anchor legends off-slide for space, employ gridlines judiciously, and iterate via audience feedback loops for refinement.
Recall a merger specialist using waterfall charts to dissect synergy savings, bars stacking acquisitions` contributions - clarifying ROI for shareholders. Or, sustainability officers plotting carbon credit trajectories with smooth curves, advocating green finance.
Refine your edge - access templates and graph success stories.
Incorporate pivot table integrations for ad-hoc queries during live sessions. For aesthetics, apply subtle shadows to 3D elements sparingly, preserving data primacy. Trailblaze with voice-activated edits via PowerPoint`s narrator coach, prepping for virtual pitches.
These tactics forge charts that resonate, informing strategies with unerring focus.
Yes, via Office 365 connections for automated refreshes.
Sampling tools included to maintain performance.
Patterns and textures as alternatives to hues.
Seamless embeds from Tableau or Power BI.
Sequential by data series for logical flow.
Visualize victory - download today and lead with data-driven designs.
Copyright © 2009-2026 ImagineLayout All rights reserved.