Enhance your financial presentations with our editable Keynote diagrams designed for executives, analysts, and finance teams. Save time and impress your audience with visually appealing charts, graphs, and infographics that make complex data easy to understand.
From quarterly reports to strategy planning sessions, these templates offer smooth animations, vector-based graphics, and finance-specific icons to elevate every slide.
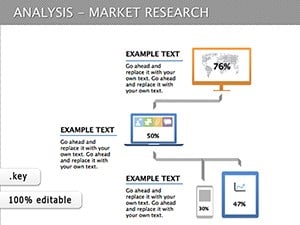
Market Research Keynote Diagrams: Insightful Visual Tools
ID: #KD00110
$15.00
(926)
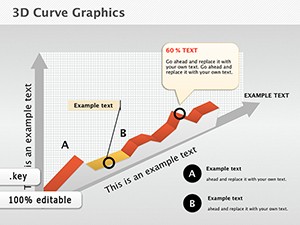
3D Curve Graphics Keynote Diagrams - Advanced Visualization
ID: #KD00105
$12.00
(1143)
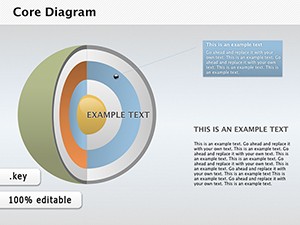
Core Keynote Diagrams - 3D Sphere Models for Insight
ID: #KD00104
$28.00
(1040)
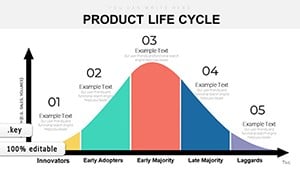
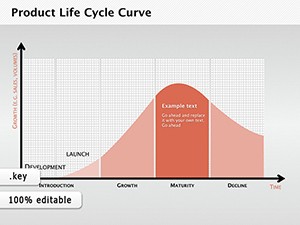
Product Life Cycle Curve Keynote Diagrams
ID: #KD00101
$12.69
(862)
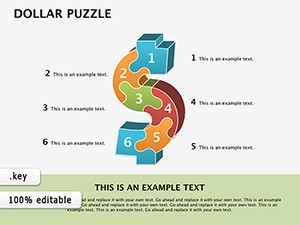
Dollar Puzzle Keynote Diagrams: Piece Together Financial Narratives
ID: #KD00094
$16.00
(89)
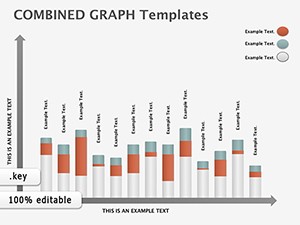
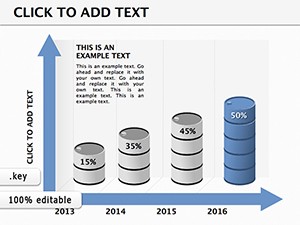
Column Graph Keynote Diagrams: Visualize Market Dynamics with Ease
ID: #KD00089
$10.99
(669)
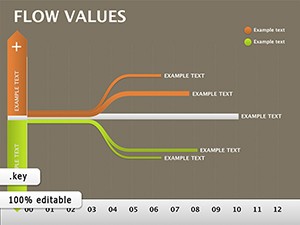
Flow Values Keynote Template: Illuminate Hidden Data Connections
ID: #KD00066
$21.00
(606)
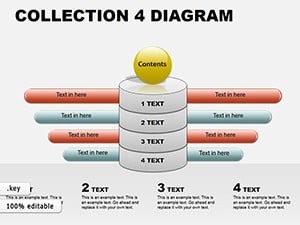
Collection of four Keynote diagrams templates
ID: #KD00063
$18.00
(91)
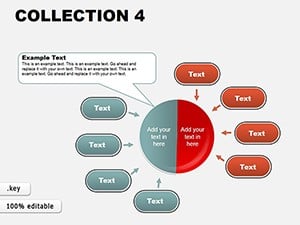
Keynote Diagram Collection 4: Weave Data into Dynamic Narratives
ID: #KD00062
$18.00
(116)
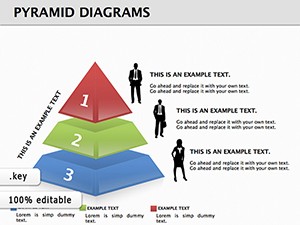
Pyramid Keynote Template: 11 Editable Slides
ID: #KD00053
$22.00
(1199)
Business Keynote Diagrams Template: Chart Your Path to Independence
ID: #KD00022
$20.00
Why Choose Finance Keynote Diagrams
Our Keynote diagrams provide a professional edge for your financial presentations, helping you communicate data clearly and efficiently.
Real-World Use Cases
Investor Updates: Animated org charts showing capital flows
Performance Analysis: Heat maps for market variances
Planning Sessions: Swimlane diagrams for process audits
Training: Stepper slides for financial modeling
Marketing ROI visuals and HR budget trackers
Benefits vs Default Templates
Unlike standard Keynote shapes, these diagrams are ready-to-animate, save 40% of preparation time, and feature high-fidelity exports, cinematic transitions, and seamless iCloud collaboration.
Creative Tips and Best Practices
Use morphing charts to illustrate budget changes
Layer masks for custom currency symbols
Sync colors across slides for brand consistency
Preview on iPad for mobile-ready presentations
Design with flair and integrate with Apple Shortcuts for automatic updates to impress your audience.
FAQs
What animations are built-in?
Scale, rotate, and dissolve effects for smooth data reveals.
Are these diagrams iOS compatible?
Fully compatible and touch-optimized for all Apple devices.
How do I add data sources?
Drag data from Numbers or Excel for instant chart updates.
What export options are available?
Export as PDF, video, or PowerPoint slides for versatility.