Revolutionize how you communicate industrial workflows with our factory production PowerPoint templates. Tailored for manufacturing leaders, engineers, and operations managers, these designs capture the rhythm of production lines through detailed diagrams and robust data visualizations.
From assembly floor overviews to supply chain breakdowns, each template includes layered schematics, gear-themed icons, and metallic color palettes that evoke machinery and momentum. Perfect for quarterly reviews or training sessions, they help demystify complex processes, fostering better team alignment and decision-making.
With built-in timelines for production cycles and customizable gauges for output metrics, you`ll present insights that drive efficiency. Download now to gear up your presentations for maximum impact in the industrial arena.


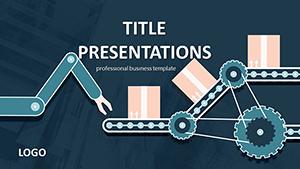


Factory production templates go beyond basic charts by incorporating 3D-like renders of conveyor belts and workflow arrows, making abstract efficiencies tangible. Standard templates often lack this depth, resulting in cluttered slides; ours prioritize clarity with modular sections that snap into place effortlessly.
Audiences in automotive, electronics, and food processing gain from slides that mirror real factory layouts, enabling quick scans of bottlenecks or successes. For example, a plant supervisor highlighted downtime reductions using our bottleneck infographic, sparking immediate process tweaks.
Versus off-the-shelf options, these cut preparation time in half while boosting retention through visual storytelling rooted in industry realities.
Unlock layers of interactivity with hover-effect placeholders and scalable vector graphics that retain sharpness on large screens. Best practices: Align data with production phases - input, process, output - for logical progression that mirrors factory flow.
Consider a case where an aerospace firm adapted our "Assembly Mastery" template to simulate part sequencing, reducing errors by 25% post-presentation. Such creative uses extend to predictive maintenance visuals, forecasting equipment life with trend lines.
Gear up for your next review - download a template instantly.
Spanning from batch processing in pharmaceuticals to just-in-time in retail, these templates support 60+ slide variations. Industry data reveals that visually mapped processes improve comprehension by 60%, underscoring their role in operational excellence.
Engineer better outcomes - browse and download now.
Copyright © 2009-2026 ImagineLayout All rights reserved.