Master the art of illustrating growth with our expansion diagram PowerPoint templates. These specialized designs feature intricate diagrams - from radial expansions to linear timelines - that break down business scaling, project phases, and market entries with precision.
Targeted at strategists, consultants, and executives, they offer benefits like instant clarity for stakeholders and reduced miscommunication. Customize nodes, arrows, and labels to reflect your unique expansion roadmap.
With vector-based elements, your diagrams remain sharp at any zoom. Perfect for boardrooms or reports, they turn abstract plans into tangible visuals.
Peruse our variety and pick diagrams that fit your narrative. Download to start building compelling stories of progress.
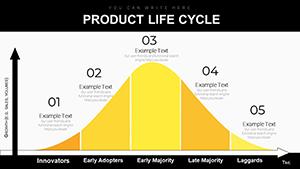
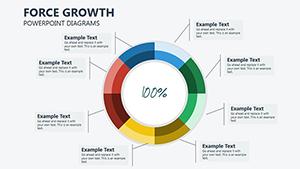
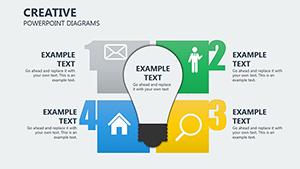
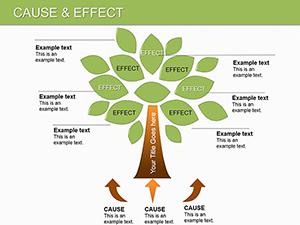
Expansion diagrams are essential for depicting how businesses or projects grow over time. Our PowerPoint templates provide ready-made structures like tree diagrams for organizational expansion or cycle charts for iterative scaling, all editable to suit your data.
Consultants praise them for distilling multifaceted strategies into digestible formats, fostering better decision-making. In contrast to hand-drawn sketches, these offer professional polish and scalability.
Users in manufacturing applied a flowchart template to outline factory expansions, streamlining approvals.
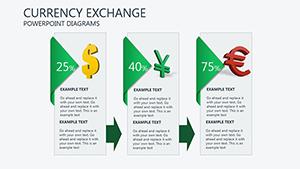
In retail, visualize store network growth with geographic bubble diagrams. Tech firms use process maps to chart software rollouts across regions.
Nonprofits diagram program scaling, showing resource allocation flows. The templates` modularity allows mixing diagram styles for hybrid views.
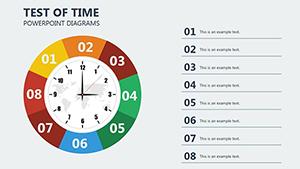
Follow guidelines like using consistent line weights and limiting nodes to seven per diagram. Animate builds sequentially to reveal expansion logic step-by-step.
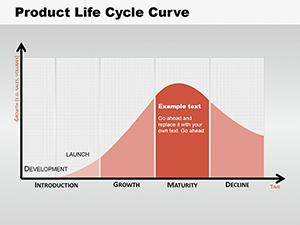
Layer timelines with milestone markers for project expansions. Best practice: Pair with narrative text boxes explaining each branch.
A logistics manager used our template to model route expansions, optimizing routes by 25%.
Empower your strategies with precise visuals. Select a diagram template and chart your course forward.
Discover more resources in our expansion collection.
Copyright © 2009-2026 ImagineLayout All rights reserved.