Unlock the potential of your data with our editable Entity Relationship PowerPoint diagrams. Designed for analysts, educators, and project managers these templates make complex databases and system connections easy to understand and present.
From mapping customer relationships to visualizing software architectures our collection provides clarity with minimal effort. Scalable vectors and color-coded entities ensure each diagram communicates your data story effectively.

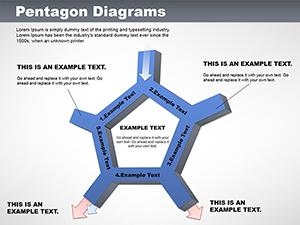
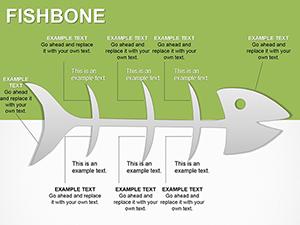
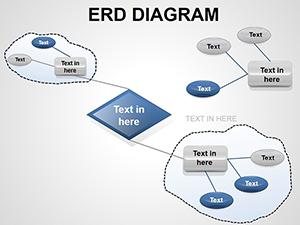
Entity Relationship diagrams are crucial in showcasing data structures clearly and professionally. Our templates save time with pre-built shapes and connectors that adapt to your content.
Use cases include database modeling software planning and business process mapping. Unlike default PowerPoint shapes our templates provide polished visuals with consistent color schemes and alignment for quick comprehension.
Download our templates today and make your ER presentations engaging and clear.
Yes core elements convert easily with minor adjustments.
You can link Excel data for automatic updates in your diagrams.
Yes add animated connections to guide viewers through data flows.
There are 50+ fully editable ER diagram templates ready to use.
Copyright © 2009-2026 ImagineLayout All rights reserved.