Our entity relationship Keynote templates empower you to diagram database architectures with Apple`s elegant precision, ideal for tech educators, app developers, and data architects who value clarity in collaboration.
Employing clean vectors, interactive hotspots, and theme-aware styling, these templates let you define entities, attributes, and bonds with minimal effort. Keynote`s physics-based animations bring relationships to life, simulating connections dynamically.
Suitable for workshops or whitepapers, they foster understanding across teams. Curate your ideal setup from our offerings and innovate smarter.
Map your data destiny - view Keynote ER diagram templates.
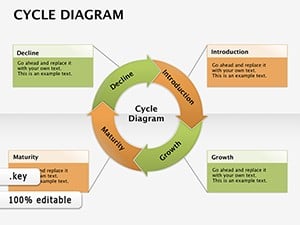
These templates translate relational modeling into Keynote slides, using entities as bounded boxes and relationships as annotated arrows. They incorporate participation constraints visually, aiding in comprehensive schema planning.
Leveraging Keynote`s infinite canvas, you can expand diagrams fluidly, perfect for iterative design sessions.
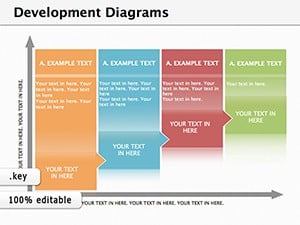
App developers prototype user flows with ERDs, linking profiles to preferences for personalized features. In policy-making, they chart regulatory entities to compliance paths.
Freelance analysts use them for client audits, uncovering inefficiencies visually.
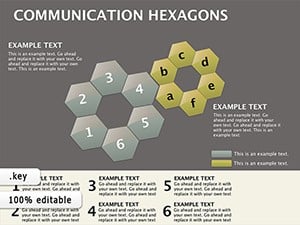
Standard shapes in Keynote demand constant realignment; our templates use grouped objects with inheritance, syncing changes globally. They add tooltip layers for attribute details on hover.
Accessibility integrations, like voice-over labels, make them inclusive for diverse audiences.
| Function | Default Shapes | ER Templates |
|---|---|---|
| Relationship Arrows | Plain lines | Directional with labels |
| Entity Grouping | Manual | Auto-clustered |
| Export Quality | Basic | High-res vectors |
These upgrades streamline from concept to code.
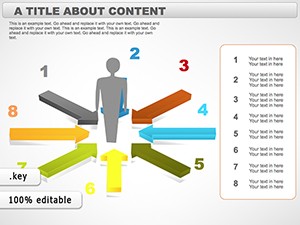
Normalize early: visualize keys distinctly to spot redundancies. Use sub-slides for subsystems.
Test interconnections by tracing paths mentally.
An edtech firm modeled learning paths with our template, enhancing platform navigation and user satisfaction. Research labs diagrammed experimental variables, accelerating publication timelines.
Startups pitched scalable architectures, attracting investors with crystal-clear visuals.
Build robustly - acquire a Keynote ER template today.
Join our webinars for hands-on sessions.
Copyright © 2009-2026 ImagineLayout All rights reserved.