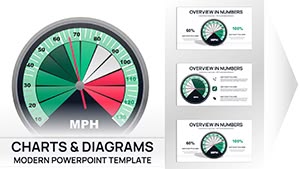
Boost your email marketing presentations with our email PowerPoint chart templates. Perfect for marketers analysts and business owners these charts simplify open rates click-throughs conversion metrics and campaign performance into clear visuals.
With intuitive layouts color-coded graphs and editable data fields these templates save time and enhance clarity. Ideal for team meetings stakeholder reports and training sessions they turn raw email data into actionable insights that drive strategy.
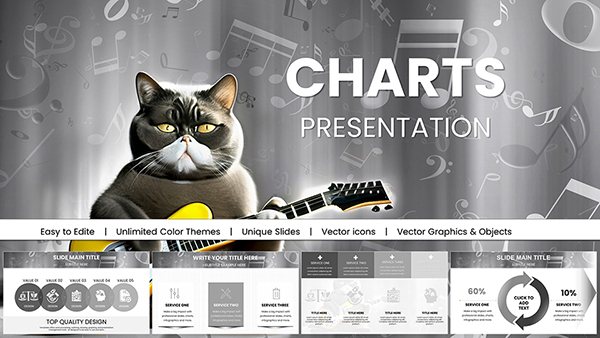
Default PowerPoint charts often require tedious formatting and fail to highlight key insights. Our email PowerPoint charts are designed for immediate use with color palettes, icons and layouts optimized for email metrics.
Real-World Use Cases
Marketing Reports: Present campaign open rates CTRs conversions and trends
Education: Teach digital marketing metrics with visual examples
Freelancers: Create client reports with heatmaps and segmentation charts
Non-Profits: Track donor engagement and newsletter performance
Benefits Over Default Templates
Fully editable charts including colors fonts and layouts
Pre-built themed palettes optimized for email data
Supports animated transitions for dynamic presentations
Time-saving design focused on clarity and impact
Creative Tips and Best Practices
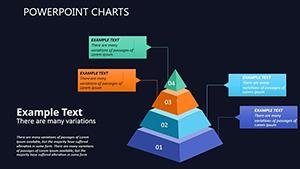
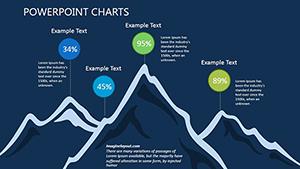
Use column charts for comparisons and line charts for trends
Limit colors to 4-5 for focus and readability
Include legends and annotations for context
Combine charts with brief narratives to guide interpretation
Enhance your email analytics presentations with charts that clearly communicate value. Download now and start transforming your data.
Frequently Asked Questions
How do I import data into these email chart templates?
Simply link your Excel file or copy-paste values directly into the chart editor.
Are charts responsive for different screens?
Yes they scale automatically for desktops and mobiles.
Can I add animations?
Yes pre-set options allow smooth transitions for data reveals.
Are more chart types available?
Our library includes various chart types; contact support for custom requests.