Dive into the art of analytical storytelling with our cause and effect PowerPoint diagram templates, engineered for clarity in dissecting problems and solutions. Tailored for managers, educators, and analysts, these designs unravel intricate relationships through intuitive fishbone structures, flowcharts, and relational arrows.
From root cause investigations in manufacturing to behavioral insights in marketing, our templates provide the scaffolding to build persuasive arguments. With editable vectors and color-coded categories, you can highlight primary drivers and secondary influences with minimal effort, ensuring your audience grasps the "why" behind the "what."
Optimized for Microsoft PowerPoint, they support animations that reveal layers progressively, building suspense and understanding. Whether troubleshooting processes or forecasting outcomes, these tools empower precise communication. Peruse our selection and streamline your next analysis today.

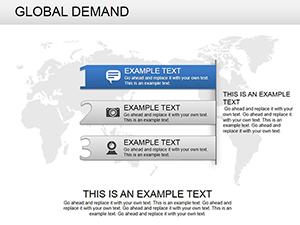
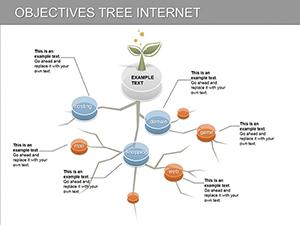
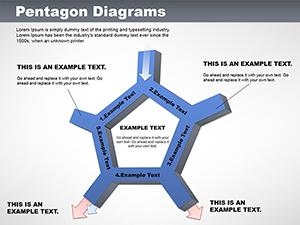
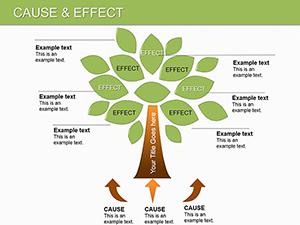
Effective problem-solving starts with visualization, and our PowerPoint templates excel here by offering modular designs that adapt to any scenario. Fishbone diagrams, for instance, branch out causes into method, material, and manpower categories, while arrow flows trace effects back to origins - far surpassing scattered bullet points.
Teams in quality control rave about the scalability: Resize branches for deep dives or simplify for executive overviews, all while maintaining alignment.
Versatile across sectors, they foster proactive decision-making.
Default PowerPoint shapes often result in messy, unprofessional diagrams that confuse rather than clarify. Ours pre-assemble with smart guides for perfect spacing and theme-consistent styling, reducing creation time by 70%. Plus, embedded hyperlinks allow drilling down into data sources mid-presentation.
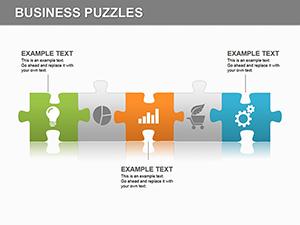
The proof is in the polish: Gradient fills for emphasis and shadow effects for depth, creating diagrams that pop without distraction.
Precision: Auto-align features keep elements tidy. Interactivity: Clickable paths for exploratory views. Accessibility: Alt-text ready for inclusive sharing.
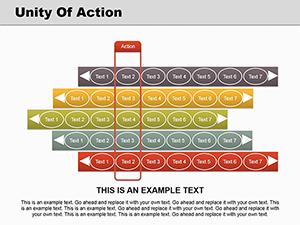
Anchor your diagram with a clear problem statement slide, then animate reveals to guide the narrative. Use contrasting colors for causes (cool tones) versus effects (warm tones) to subconsciously direct focus. Follow up with action items tied to each branch, ensuring discussions lead to resolutions.
Innovative twist: Integrate QR codes on slides linking to interactive online versions for post-meeting exploration. Always rehearse transitions to maintain flow.
Transform analysis into action? Explore cause and effect PowerPoint diagram templates and download the perfect fit now.
These diagrams don`t just illustrate - they illuminate paths to solutions. Harness them for presentations that drive real change.
Copyright © 2009-2026 ImagineLayout All rights reserved.