Environmental and sustainability topics deserve visuals that reflect their importance. Our PowerPoint eco diagram templates combine meaningful content structure with nature-inspired aesthetics to create compelling presentations about green initiatives.
Designed with earth-conscious style, these templates feature organic shapes, green color palettes, natural textures, and cycle diagrams that reinforce sustainability messages visually.
Perfect for corporate responsibility reports, environmental education, and green business strategies.

Visuals aligned with sustainability themes strengthen message authenticity. Cycle diagrams, impact flows, and ecosystem models help audiences understand complex environmental relationships while the design itself communicates care for the planet.
Effective eco diagrams balance information density with natural, calming aesthetics.
Over 75 templates focused on environmental and sustainability visualization.
All featuring eco-friendly color schemes and organic design elements.
Present ESG metrics, carbon reduction progress, and sustainable practices to stakeholders.
Explain ecosystems, climate impacts, or conservation strategies in classrooms and workshops.
Show circular economy models, waste reduction plans, or renewable energy transitions.
Illustrate environmental challenges and solutions for fundraising and awareness campaigns.
These templates help communicators deliver powerful, authentic sustainability messages.
Standard diagrams lack thematic coherence. Our eco templates integrate meaningful nature motifs, appropriate color psychology, textured backgrounds, and leaf/tree icons that reinforce environmental messaging while maintaining professional clarity.
Find the perfect eco diagram for your sustainability presentation and download today.
Best approaches:
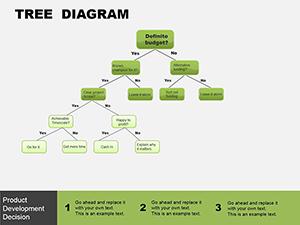
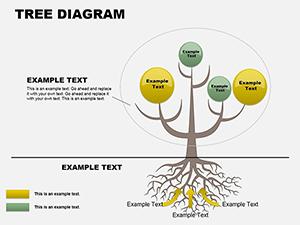
Creative idea: Use tree or root structures to show growth from sustainability initiatives.
Consider leaf progression icons to indicate stages of environmental improvement.
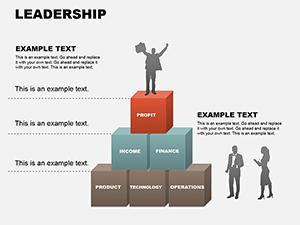
Circular economy, ecosystem maps, sustainability pillars, carbon flows, and impact cycles.
Yes, all feature nature-inspired colors, organic shapes, and environmental icons.
Completely - modify colors, text, shapes, and layout in PowerPoint.
Yes, several high-quality free sustainability diagrams are available.
Absolutely, they're designed for professional sustainability and ESG presentations.
Copyright © 2009-2026 ImagineLayout All rights reserved.