Navigate the intricacies of environmental systems with our Eco Keynote Diagram Templates, optimized for Apple`s Keynote to deliver precise, aesthetically pleasing illustrations. Targeted at ecologists, policy analysts, and green strategists, these templates include flowcharts for energy cycles, Venn diagrams for habitat overlaps, and mind maps for conservation strategies.
Designed with scalability in mind, they adapt to detailed analyses or high-level overviews, using soft gradients and natural icons to soften technical edges. Customize paths, nodes, and labels to fit your data, creating diagrams that clarify interconnections and drive informed decisions.
Peruse the selection and enhance your Keynote arsenal with diagrams that diagram a healthier planet.
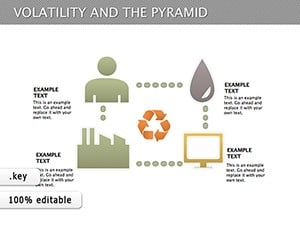
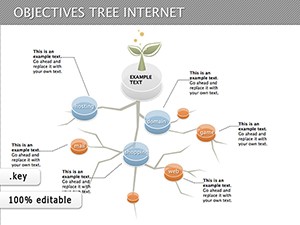
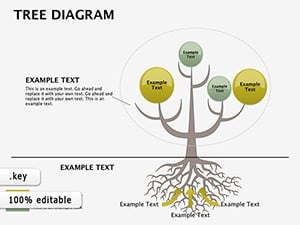


These diagrams prove invaluable in unraveling environmental complexities, like in watershed management plans where Sankey diagrams trace water usage, or biodiversity assessments using tree structures to branch species relationships. In boardrooms, they support carbon accounting with hierarchical org charts for emission sources.
Researchers employ cycle diagrams for nutrient flows in ecosystems, while advocates use bubble charts to prioritize threats in campaigns. Educational webinars benefit from process diagrams outlining recycling loops.
Outshining Keynote`s built-ins, ours feature auto-align tools and thematic connectors, streamlining creation.
Key strengths lie in vector-based scalability and built-in accessibility tags for screen readers. Pro tips: Start with core nodes and expand outward; employ consistent arrow styles for directionality; and color-code by urgency levels, like red for high-risk areas. This approach enhances comprehension in multi-stakeholder reviews.
Implementing these elevates diagrams from static images to interactive guides fostering deeper eco-insights.
Clarify your eco-vision - grab a diagram template and plot sustainable solutions.
With these assets, your Keynote presentations become blueprints for environmental progress, engaging minds toward actionable change.
Copyright © 2009-2026 ImagineLayout All rights reserved.