Demystify data with our precision-engineered Keynote diagram templates, suited for strategists, researchers, and visual thinkers who demand clarity in complexity. Harness Keynote`s vector prowess for diagrams that range from linear processes to intricate networks, all with editable paths and scalable nodes that maintain fidelity across exports.
These templates shine in collaborative environments, supporting shared annotations and version histories while delivering smooth builds for guided explorations. From org charts to algorithm breakdowns, they distill intricacies into elegant visuals that facilitate understanding and decision-making. Embrace tools that align with your workflow for faster, sharper insights.
Examine our diagrams and select one to diagram your breakthrough. Precision awaits!
Our Keynote diagrams excel with adaptive connectors, shadow effects, and data-binding capabilities, outpacing basic shapes for professional-grade visualizations.
These features empower precise communication in analytical contexts.
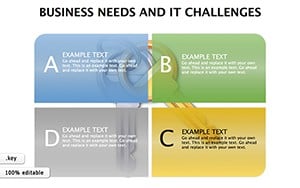
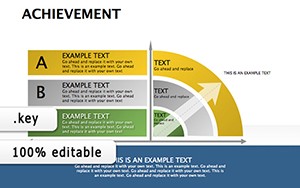
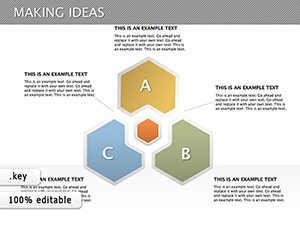
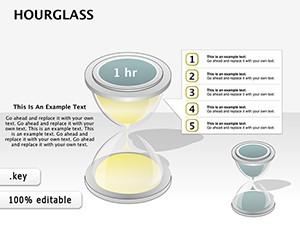
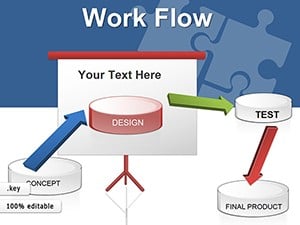
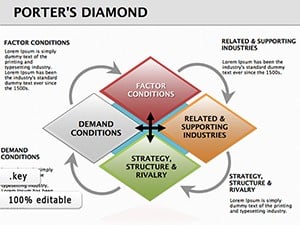
Researchers plot experiment flows with sequential arrows. Managers chart team roles via radial hubs. Developers sketch API integrations with modular blocks.
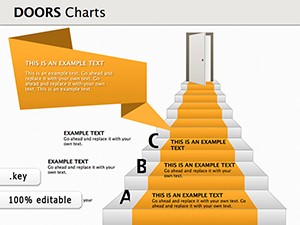
Methodology maps trace steps to outcomes logically.
Role webs clarify reporting lines instantly.
Endpoint diagrams illustrate interactions cleanly.
Keynote defaults lack interconnectivity; ours offer grouping and rotation freedoms. Pro moves: Align via guides and embed hyperlinks in nodes.
In a risk assessment, color-coded branches signal probabilities dynamically.
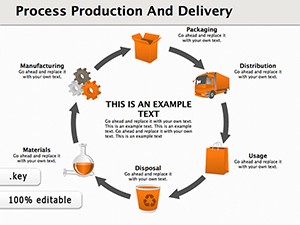
Conceive a supply chain model: Linked segments animate disruptions for scenario planning. Or, neural network sketches with node pulses for AI demos.
These examples underscore diagramming`s power in foresight.
Acquire now and clarify complexities.
Copyright © 2009-2026 ImagineLayout All rights reserved.