Illustrate pathways to success with our development-focused PowerPoint diagrams. Ideal for trainers, consultants, and teams focused on growth, these templates feature intricate flowcharts, cycle models, and hierarchical structures that clarify complex development concepts. Transform abstract ideas into tangible visuals that drive understanding and action.
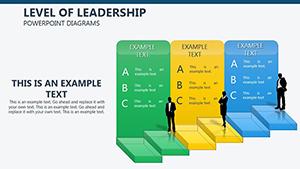
Built with vector precision, each diagram allows drag-and-drop edits, color shifts, and data inputs for personalized insights. Picture a workshop slide where a development pyramid builds layer by layer, mirroring participant progress - our templates make such engagement routine.
Suited for HR developers, life coaches, and educational facilitators, they enhance training sessions and strategic planning. Scan the gallery below and diagram your development narrative. Fuel progress now - delve into our PowerPoint development diagrams.
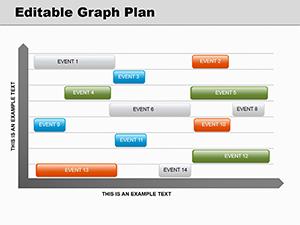

Development topics thrive on clear visuals, and our PowerPoint diagrams excel here. From radial skill wheels to linear progress timelines, they offer more nuance than basic shapes, with smart connectors that auto-adjust for flawless flows. Embedded icons and gradients add professional depth.
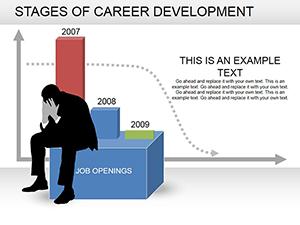
Coaches map client journeys with goal-setting funnels, highlighting bottlenecks visually. Managers depict org development with layered org charts, revealing promotion paths. Educators illustrate learning curves, using scatter plots for skill acquisition trends.
In a recent seminar, a diagram`s branching decision tree clarified career forks, sparking lively discussions. Harness this power for your sessions.
Corporate training uses cycle diagrams for continuous improvement models, looping feedback into action plans. Non-profits chart program evolutions, from inception to impact measurement. Healthcare professionals outline patient rehab paths with milestone markers.
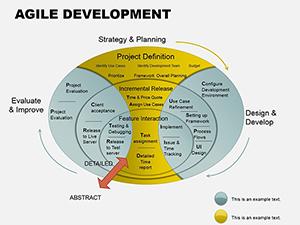
Tech teams visualize agile sprints as development ladders, tracking velocity climbs. Sales development reps employ pipeline diagrams to forecast conversions accurately.
Apply these for diagrams that inform and motivate. Browse our selection to blueprint success.
Innovate with mind-map hybrids for brainstorming sessions, branching ideas into development strategies. Personal planners create habit trackers as circular diagrams, monitoring consistency loops. Event coordinators diagram agenda flows, ensuring balanced timing heights.
A consultant adapted a template for SWOT visualizations in development audits, uncovering hidden opportunities. Such versatility ignites creativity.
Chart your course - download a diagram pack and develop dynamically.
Flowcharts, pyramids, cycles, timelines, and radial models tailored to growth themes.
Yes, via PowerPoint`s data tools for automatic chart refreshes.
Fully - adjust entrances, paths, and durations in the Animation pane.
Optimized grouping keeps performance smooth even with extensive elements.
Designed for 2016+, with fallbacks for earlier via static exports.
Yes, alt text prompts and high-contrast options for inclusive viewing.
Visualize victory - start diagramming your development right away.
Copyright © 2009-2026 ImagineLayout All rights reserved.